The notion that the gold price is based on the economics of “Supply & Demand” turns out to be incorrect as the cost of production is the leading factor. This is also true for most commodities and energy.
Unfortunately, economists and most analysts in the precious metals community will continue to believe that the economic principle of supply and demand determines the price. If we look at the data provided in this article, the individual will see how closely related the cost of gold production is to the spot price.
That being said, the information in this article is only to show the “commodity pricing mechanism” of gold, not its true store of value. There’s a big difference that 99% of the Mainstream media do not understand… and probably a good percentage in the precious metals community as well.
Top Two Gold Miners' Cost Of Production vs. The Gold Value
I decided to take the data from the top two gold miners, Barrick and Newmont, for this exercise as they are the largest two gold producers in the world. Yes, I could have spent several days compiling data from the top 20 gold miners, but I don’t have the luxury of being paid by a financial institution for my analysis. Regardless, Barrick and Newmont provide a good representation of the cost of producing gold in the entire industry.
According to my “Adjusted Income Approach” in determining the full cost of production, I constructed the chart below. One thing that is not included in the adjusted income approach is dividend payouts. I included this in my total cost per ounce for Barrick and Newmont:
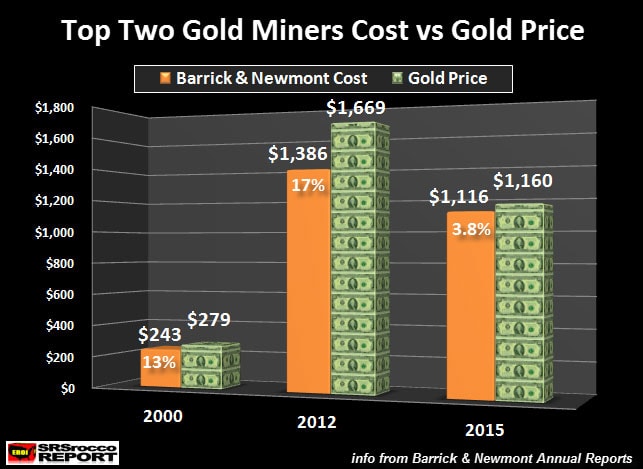
Here we can see that as the price of gold increased over the past 15 years, so did the cost of production for these top two gold miners. In 2000, the total average cost to produce gold for Barrick and Newmont was $243 versus the spot price of $279. Thus, the average profit margin was 13% for these gold mining companies that year.
As the average price of gold surged to a record $1,669 in 2012, the average cost to produce the yellow metal for Barrick and Newmont increased to $1,386. Yes, it’s true that these two gold miners enjoyed a 17% profit margin that year, but what is wrong with that?? Companies must have profits so they can pay for new projects, shareholder dividends, or surplus cash for lean years when losses are incurred.
If we compare the increase in the gold price from 2000 to 2012 versus the cost of production, we will see a very interesting similar trend:
Gold Price Increase vs Cost Of Production 2000-2012
Gold Price Increase 2000 – 2012 = 498%
Gold Cost Increase 2000 – 2012 = 470%
While the average gold spot price increased 498% from 2000-2012, the cost of production for Barrick and Newmont jumped 470%. To put it another way, the difference between the increased cost of production (470%) and the average spot price (498%) in the 2000-2012 time period, was a lousy 6%.
Does the gold mining industry deserve a paltry 6% profit margin over that period?? This means… that economists can throw out the window the worthless principle of supply and demand.
So, why did the cost of gold production increase so much since 2000?? Could it have anything to do with the increased cost of energy? Well, yes it did. I wrote about this in my previous article, Why Most Analysts’ Gold & Silver Forecasts Are Wrong.
In the article, I show how the price of a barrel of oil increased from $20 in 2000 to $112 in 2012. Thus, the gold cost of production increased nearly five times on the back of a five times increase in the price of oil during that period.
Now, if we look at the data for 2015, the top two gold miners' profit margin fell to 3.8% as their cost per ounce was $1,116 compared to the $1,160 spot price. The reason the cost of production declined in 2015 versus 2012, was due to the oil price (as well as other energy inputs) falling more than 50%.
Okay, I imagine many reading this article would wonder why I have stated that the gold price will skyrocket in the future as the price of oil collapses toward $12 by 2020. This doesn’t make sense because a lower energy price would also dictate a lower cost of production… hence the gold spot price will fall as well.
As I stated at the beginning of the article, this information only pertains to the “commodity pricing mechanism” of gold, not is true “high-quality store of value.” Gold or silver (to a lesser extent) are not commodities, rather they function as money or stores of wealth. There is a much different way to attribute value to these precious metals than their cost of production. I will touch on that at the end of the article, but there is more information about the cost of gold production we need to understand first.
Gold Cost Of Production Understated Due To Massive Share Dilution and Increased Debt
The gold cost of production for Barrick and Newmont is understated due to the massive amount of share dilution and increased debt. First, let’s look at the change in outstanding shares for these two gold mining companies:
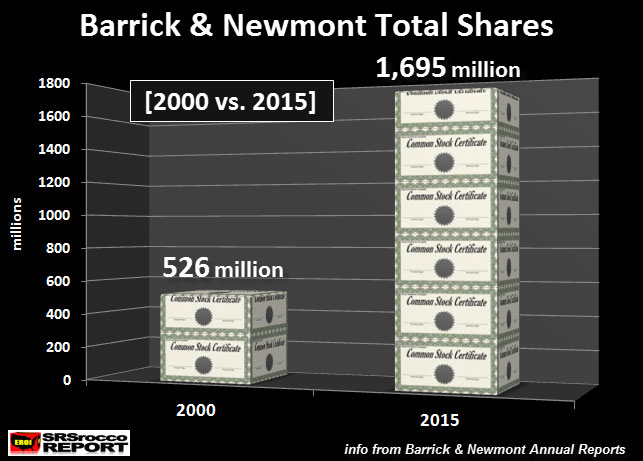
Barrick and Newmont’s outstanding shares have more than tripled from 526 million in 2000 to 1,695 million (1.69 billion) shares in 2015. These two gold mining companies could not afford to expand production from just their surplus profits. Instead, they resorted to issuing more shares to purchase new gold mines or fund new projects.
This means the shareholder took some of the burden for the increased cost or expanded production. While it's hard to put a figure on how much higher the cost to produce gold would have been if the shareholder was not used to fund this activity, we can safely assume that it would be higher than it is today.
Secondly, the total liabilities for these two companies have surged to $32.9 billion in 2015 versus $3.8 billion in 2000:
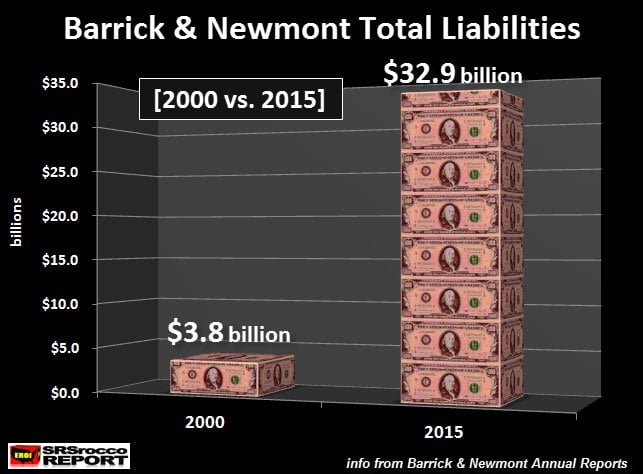
Here we can see that Barrick and Newmont’s total liabilities are nearly ten times higher than they were in 2000. Of course, some readers will say that these companies expanded production and increased gold projects have also increased their total assets. Yes, this is true… but, if we look at their net increase in gold production since 2000, something seems very wrong here:
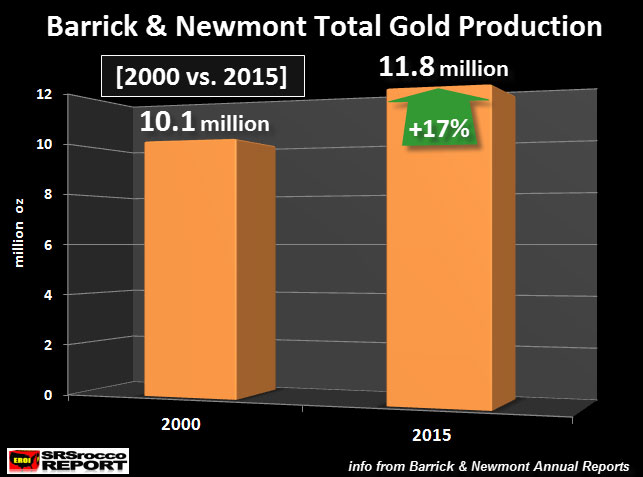
The net result of the increased gold production for Barrick and Newmont since 2000, turns out to be 1.7 million oz, or 17%. Even though these two companies enjoyed higher production in past years, they only produced 17% more gold in 2015 than they did in 2000. This means a lot of their new projects were used to offset declines or shut-downs of other mining operations.
We can see from the data above, these two gold miners' cost of production would be higher if shareholder dilution and the increased debt was removed from the equation.
The Cost Of Gold Production is Not Its True Store Of Value
While the data proves that the mining industry has used its shareholder and debt increase to artificially lower the true cost of producing gold, this is not the ultimate methodology to value gold. Gold’s true value is not based on its cost of production, but rather its high-quality store of value as a basis of money in the global economy.
The reason the value of gold will skyrocket going forward is quite simple. The world has been bamboozled by Wall Street, Central Banks, and the financial media to put 99% of its investment funds in Stocks, Bonds, and Real Estate. As oil production and consumption increased in the past, this allowed Global GDP and net worth to grow.
Unfortunately, the net energy of a barrel of oil supplied to the market has been declining which has pushed its price to record highs. The first warning light was the U.S. Housing and Investment Banking collapse in 2008. To prop up the system, the Fed and Central Banks have thrown in trillions of dollars of liquidity. This has inflated the value of most Stocks, Bonds, and Real Estate.
As the price of oil continues to fall, along with production, this will cause a huge DEFLATIONARY WAVE of destruction throughout the global economies. The 99% of investors finally getting PRECIOUS METALS RELIGION, will move into physical gold and silver to protect wealth.
This will not be a matter of “Supply & Demand”, rather it will be due to the world realizing how few high-quality stores of value there are in the world. As most Stocks, Bonds, and Real Estate values continue to plummet, more and more investors will seek the safe-haven status of physical gold and silver.

About the Author:
Independent researcher Steve St. Angelo started to invest in precious metals in 2002. In 2008, he began researching areas of the gold and silver market that the majority of the precious metal analyst community has left unexplored. These areas include how energy and the falling EROI – Energy Returned On Invested – stand to impact the mining industry, precious metals, paper assets, and the overall economy.
