If the market finally experienced a peak in world silver production in 2016, this warns of higher prices in the future. In addition, the global silver market suffered another large net supply deficit in 2016. These factors point to a big upcoming trend change in the future silver market.
The Silver Institute just published its 2016 Silver Interim Report. This report is published by Thomson Reuters GFMS. According to their silver prices forecast for 2016, global silver production will decline to 887 million oz (Moz), down from 893 Moz in 2015:
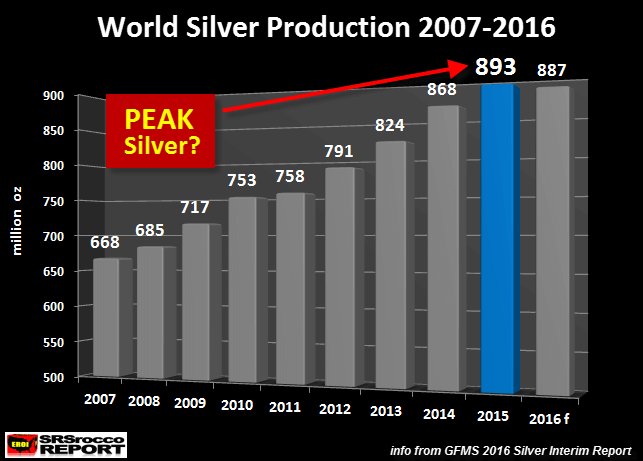
While forecasted global silver production for 2016 is down only slightly versus last year, GFMS also stated this in their report:
- We estimate that mine supply peaked in 2015 and will trend lower in the foreseeable future.
- Declining total supply is expected to be a key driver of annual deficits in the silver market going forward.

I will get to the annual silver deficits in a minute, but let’s look at their world silver supply and demand (mining) by region:
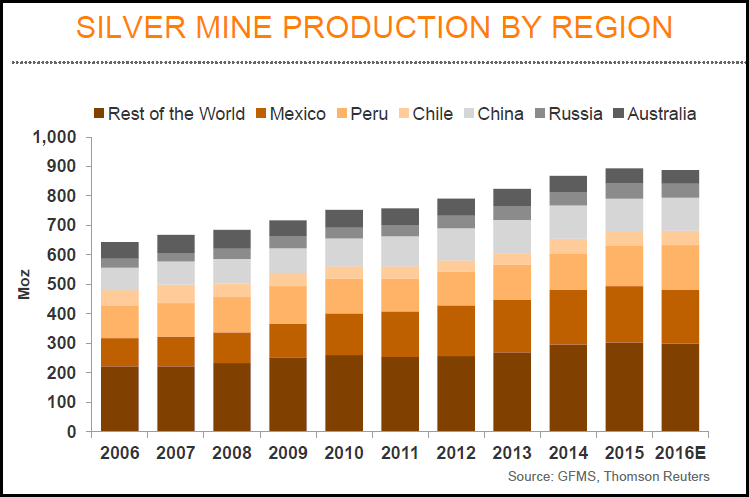
What is interesting here, is that GFMS forecasts the number one silver producer, Mexico, to be down in 2016 by more than 6 Moz. Last year, I forecasted that global silver production would likely be lower in 2015. I was going by data from the “World Metals Statistics.” However, Mexico’s INEGI (government agency) considerably revised its figures higher for 2015. While I have seen revisions take place, the revisions by Mexico’s INEGI for 2015 were quite substantial.
Regardless, GFMS does a pretty good job with the silver mine supply data. The important takeaway here is that the trend of global silver production will likely be lower going forward.
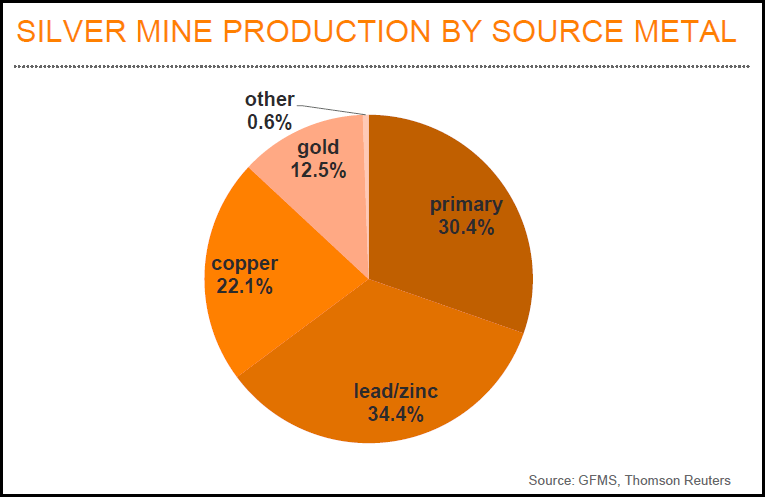
The Majority Of Global Silver Production Declines Will Come From By-Product Base Mining
The majority of silver production comes from the by-product of base metal mining. According to GFMS 2016 Silver Interim Report, lead & zinc accounted for 34.4% of silver supply, while copper yielded 22.1%. Thus, the mining of these three base metals supplied 56.5% of global silver production in 2016. Primary silver production accounted for 30.4% and gold mining supplied 12.5%:
As I have mentioned in prior articles, the decline in global oil production will impact base metal mining to a larger degree than primary silver production. It takes a great deal of liquid fuels to produce the world’s base metals.
For example, the Chilean Copper Commission stated in a 2014 report, that the country consumed 535 million gallons of liquid fuel to produce 5.7 million tons of copper. Thus Chile’s copper industry consumed 94 gallons of liquid fuel for each tonne of copper produced.
On the other hand, Pan American Silver burned 20.5 million gallons of liquid fuel to produce 26.5 million oz of silver in 2015. This means each ounce of silver production took 0.80 gallons of liquid fuel. If we use Pan American Silver as a guide, then the 269 Moz of primary silver production in 2016 consumed 215 million gallons of liquid fuel. However, I would imagine the global primary silver production average is much less, more like 0.50 gallons per ounce of silver. So, we are talking about 135-150 million gallons of liquid fuel to produce all the primary silver in the world.
Now, the world produced a total of 18.4 million tons of copper in 2014. Taking Chile’s average of 94 gallons per tonne of copper produced and providing a conservative estimate of say 75 gallons per tonne for the entire globe, then the world consumed roughly 1.4 billion gallons of liquid fuels to produce its copper in 2014. This is about ten times the amount of fuel it took to produce all the primary silver production. Of course, this is a simple estimate, but there you have it.
Once the world enters into the next financial collapse, U.S. and world oil production will plummet. This will impact base metal mining a great deal more than primary silver production. This means overall silver production will decline more rapidly due to more than half coming from zinc, lead, and copper.
Global Annual Silver Deficits Continue For 13 Consecutive Years
Due to the huge increase in Global Silver ETF demand as well as a large Exchange Inventory build, the silver market will suffer a forecasted 185 Moz annual deficit in 2016. If we look at the annual silver deficits since 2004, it equals a stunning 1.5 billion ounces:
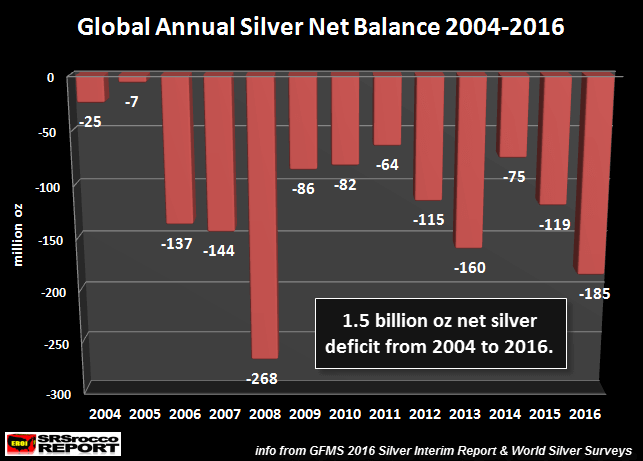
GFMS calculates their “net balance” by subtracting physical demand from the supply, then deducting or adding changes in Silver ETF and Exchange inventories. According to their data (as of Sept 2016), Silver ETFs and Exchanges added 133.3 Moz of silver to their inventories. Furthermore, total physical demand exceeded total supply by 52.2 Moz to arrive at the total 185.5 Moz (rounded to 185 Moz) net deficit.
These annual deficits have been supplemented by silver surpluses of the 1980s and 1990s. However, annual deficits are forecasted to continue as mine supply continues to decline along with subdued scrap supply.
Why Do These Supply & Demand Factors Matter For the Future Price Of Silver?
Recently I have stated that new information on the Thermodynamic Oil Collapse, based on the Hills Group and Louis Arnoux’s work, suggests that supply and demand are not the real factors that determine the price, rather it’s the cost of production.
However, gold and silver are different from most other metals, commodities, and energy. While silver is consumed more than gold, it still functions as “MONEY” or a “STORE OF VALUE.” Thus, it should be valued differently than copper, wheat, or oil.
I don’t look at global mine supply or the annual silver deficits as factors that will impact the market price of silver by certain degrees, rather I look at them as a TELLTALE sign that the overall trend is changing and has been for nearly a decade. It is the longer-term fundamental trend change that interests me, not the year-by-year supply and demand factors on price.
Currently, the silver price is based on the silver production cost (90-95%) plus some supply and demand factors. While many believe the BIG BANKS can push the price of silver anywhere they see fit, this is pure nonsense. If the Big banks pushed the price of silver 25-50% below its average primary silver cost of production, traders would come in by droves. While traders may be uninterested in long-term fundamentals, they aren’t stupid as it pertains to short-term market forces.
That being said, silver’s ultimate value is not based on its cost, it will be based on its STORE OF VALUE properties when the MOTHER OF ALL DEFLATIONS finally arrives. I am talking about the deflation of most paper assets (stocks & bonds) and real estate.
Is Silver That Rare?
Because there is so little real physical silver out in the market, 3-4 billion oz, any significant amount of capital moving into it will push its value to seriously high levels. This may seem like a play on hype, especially for those who are a bit disillusioned by the price smash since the Trump presidential election.
Unfortunately, for those who continue BELLY-ACHING about low silver prices, there isn’t much I can say to change your opinion. I have come to realize that a significant percentage of silver investors who continue to understand the long-term fundamentals, will never complain about lower prices. They just suck it up and know that insane Central Bank policies won’t last forever.
Unfortunately, the precious metals community also has its group of individuals who will complain when the going gets rough. This should be expected as this is the typical nature of a FICKLE public. All slap on the back when things are good and the first to the bad mouth when things turn south.
I get a kick out of the BELLY-ACHERS who seem to forget that the Central Banks have embarked on the most insane monetary policy in history. They have pushed debt and money supply to an exponential trend. I find it simply amazing how a disgruntled silver investor points out how wrong the precious metals analysts were on the silver price since 2012 while dismissing massive Central Bank monetary invention.
Regardless, peak silver production on top of the continued annual deficits points to a trend that will reach an INFLECTION POINT in the future. So, here is the BEEF. If you think exponentially increasing debt and monetary liquidity will continue for the next 5-10 years, then maybe you should stay in Dollars, U.S. Treasuries, Stocks, and Real Estate. However, if you aren’t suffering from brain damage as many in the markets are today, you may want to consider staying put in the 2,000+ year monetary history and store of value of silver.

About the Author:
Independent researcher Steve St. Angelo started to invest in precious metals in 2002. In 2008, he began researching areas of the gold and silver market that the majority of the precious metal analyst community has left unexplored. These areas include how energy and the falling EROI – Energy Returned On Invested – stand to impact the mining industry, precious metals, paper assets, and the overall economy.
