Silver price: 2010-2017
| Year | Average Closing Price |
Year Open | Year High | Year Low | Year Close | Annual % Change |
|---|---|---|---|---|---|---|
| 2017 | $17.07 | $16.41 | $18.51 | $15.43 | $17.13 | 7.12% |
| 2016 | $17.17 | $13.84 | $20.70 | $13.75 | $15.99 | 15.86% |
| 2015 | $15.66 | $15.71 | $18.23 | $13.70 | $13.80 | -13.59% |
| 2014 | $19.07 | $19.94 | $22.05 | $15.28 | $15.97 | -18.10% |
| 2013 | $23.79 | $30.87 | $32.23 | $18.61 | $19.50 | -34.89% |
| 2012 | $31.15 | $28.78 | $37.23 | $26.67 | $29.95 | 6.28% |
| 2011 | $35.12 | $30.67 | $48.70 | $26.16 | $28.18 | -8.00% |
| 2010 | $20.19 | $17.17 | $30.70 | $15.14 | $30.63 | 80.28% |
How low and how high will the price of silver range on the PAPER markets during 2017?
Knowing the influence central bankers, politicians, HFT algorithms, bullion banks, and JPMorgan exercise over increasingly managed markets... it is impossible to answer the question, and it is probably the wrong question to ask.
Instead, What Do We Know With A High Degree Of Certainty?
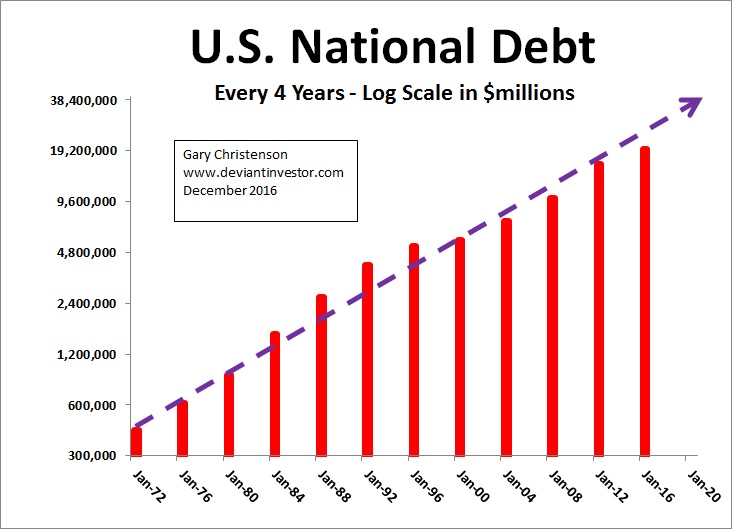
- The US national debt will substantially increase as it has almost every year since 1913. We can trust politicians and central bankers to act in their best interests to spend in excess of their revenues and increase total debt. See the chart below.
- Politicians and central bankers are unlikely to change a century of their spending, borrowing, tax, and inflation behaviors.
- The price forecast of silver on the paper markets will be volatile but, over the long term, will exponentially increase as it has since 1913.
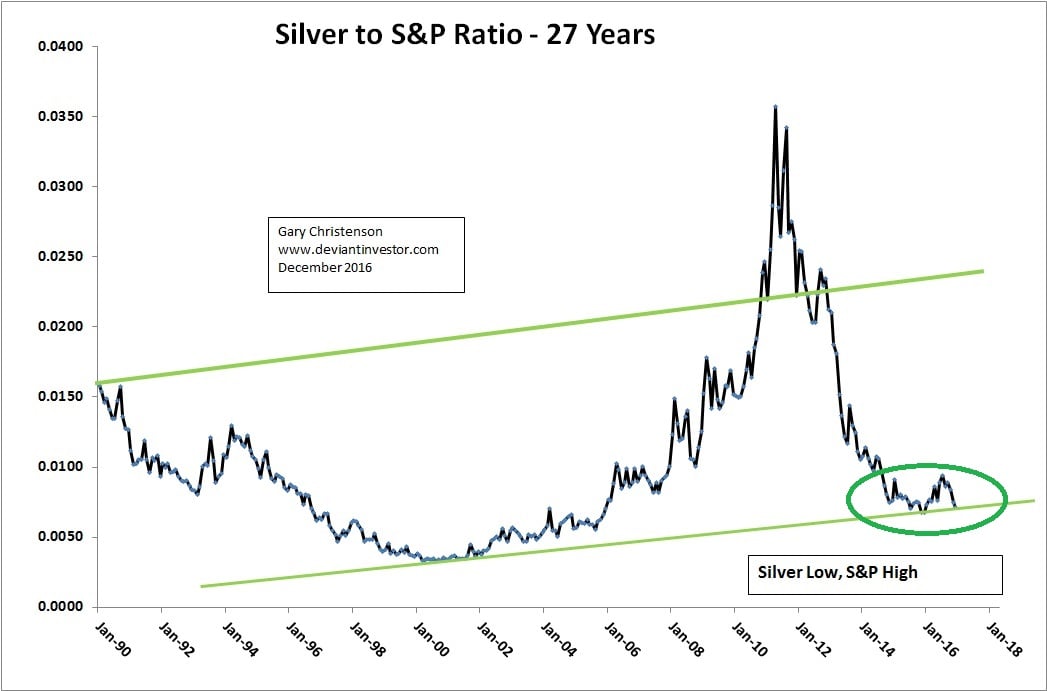
- Silver prices relative to their history and the S&P500 Index are low and far more likely to rise than to fall further. See the silver price chart below.

CONCLUSIONS
- Silver prices will, like the national debt, consumer prices, and currency in circulation, increase. The inevitable long-term direction of silver prices is upward.
- Silver prices are currently low by many measures so the probable move higher should be substantial. The risk of lower prices is small.
What Analysis Supports These Conclusions?
National Debt
Plot the official national debt on a log scale every four years – presidential election years. The exponential increase (about 9% per year – every year) is unmistakable. Doubling debt approximately every eight years is not a winning strategy for the US economy. Take cover!
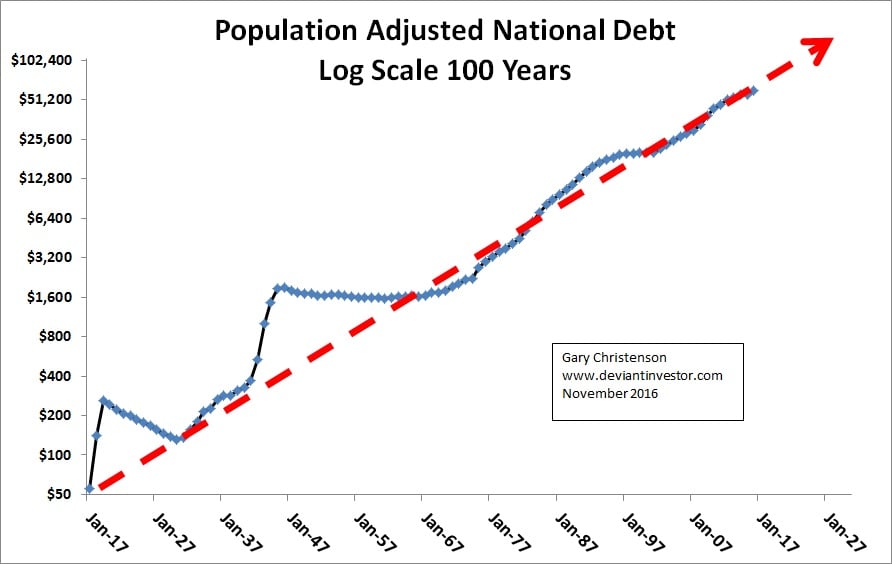
Population Adjusted National Debt
Yes, the official national debt, even adjusted for population growth, has increased exponentially for 100 years. Expect it to rise further and probably more rapidly as baby boomers retire, uncontrolled Medicare costs skyrocket, and politicians aggressively spend with borrowed currency.
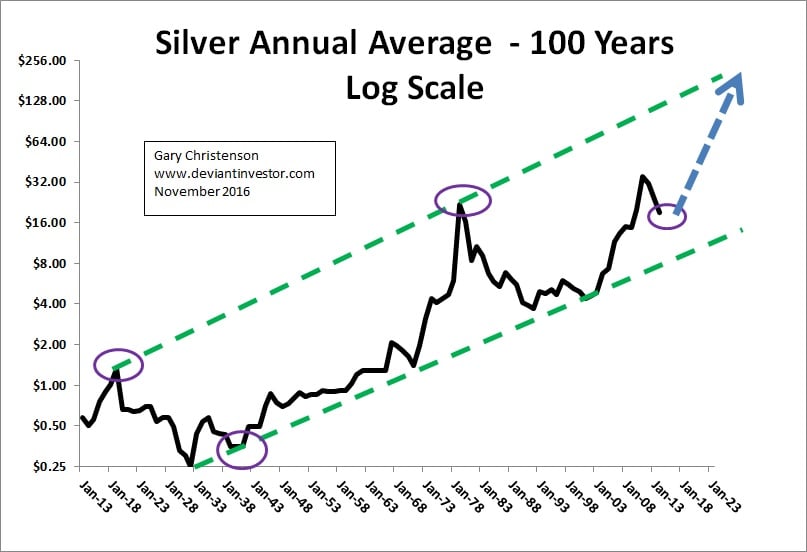
What is the Price of Silver? – The Long-Term
Silver prices have risen exponentially for 100 years, along with debt, consumer prices, and currency in circulation. Note the log scale.
Silver To S&P500 Ratio
Plot monthly prices for the ratio of silver to the S&P500 Index. In the long term both increase exponentially however the current price of silver is low compared to the price of the S&P500. Note that silver prices are off two-thirds from their 2011 high while the S&P is at an all-time high. Expect silver prices to move much higher regardless of a potential correction in the S&P.
Silver Prices On A Log Scale
Silver prices bottomed in 2001 and have risen erratically since then. The log scale trend channel has expanded which indicates wide volatility because silver prices rise too rapidly and then crash. Prices are currently at the low end of the expanding channel. Expect the silver price forecast for 2017 to rise substantially from here.
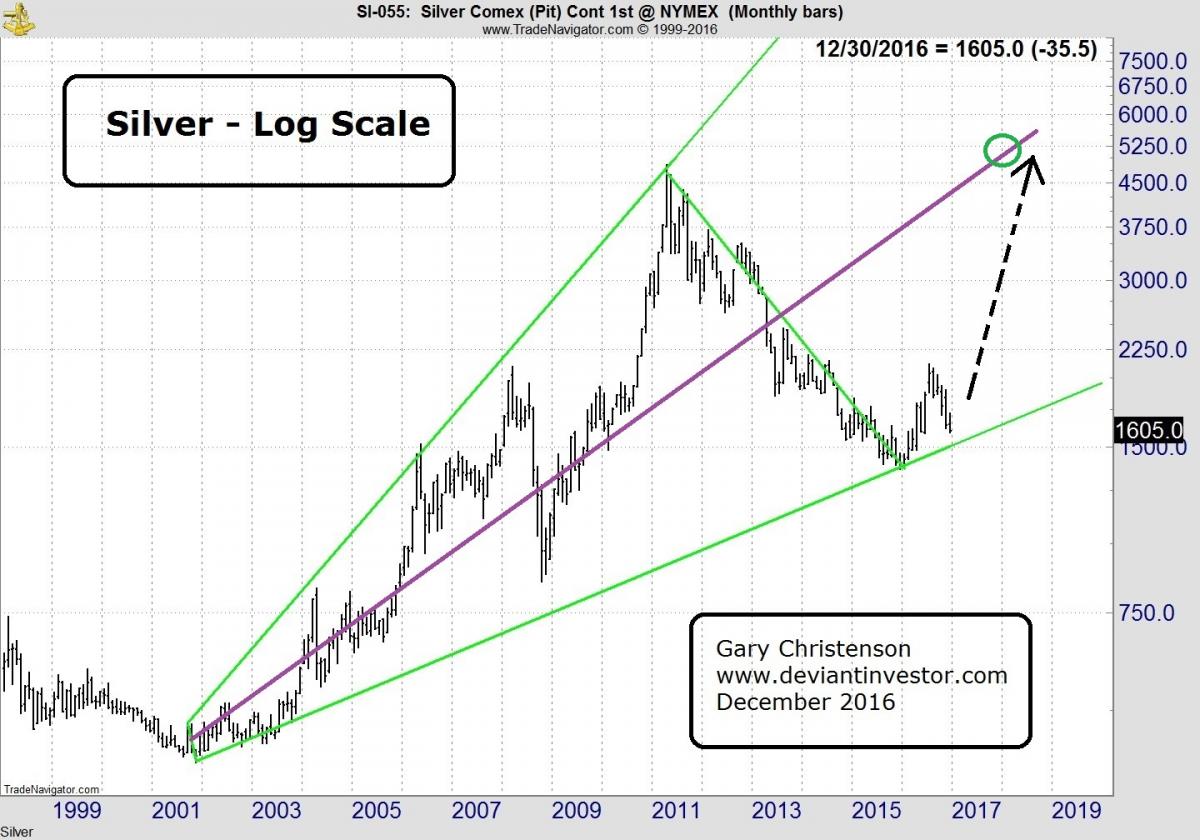
How High?
The center line of the expanding channel reaches approximately $50 by the end of 2017. The high end of the channel is about three times higher. This guarantees nothing but it indicates, based on the last 17 years of price history, that a paper silver price of $50 should NOT be surprising. Of course, it will be a shock according to official pronouncements from “experts” on Wall Street who believe that all savings should be invested (trapped) in their digital accounts, but... consider the source.
From The Burning Platform:
...there is only one thing more frightening than not knowing what is coming next, and that is living in a world run by ‘experts’ who think they know exactly what is going to happen next. These are the same ‘experts’ who didn’t see the 2005 housing bubble, the 2008 financial collapse, the EU implosion, Brexit, or the Trump presidency.
Risk And Debt!
Our financial world sits upon a precarious peak of debt, monetary ignorance, rising interest rates, risky derivatives, and flawed economic models, while politicians and central bankers aggressively pursue failed policies, to the detriment of all but the financial and political elite. 2017 will probably be the year of the implosion and that suggests silver prices–check out the price of a silver bar as a reference– should easily exceed $30. I certainly will not be surprised if the paper silver price reaches and exceeds $50 in 2017 – 2018. Based on spending, debt, warfare, welfare, currency devaluations, monetary stupidity, cyber wars, loss or dollar reserve currency status, declining silver ore concentrations, central bank interventions, currency wars, Italian banking problems, and so much more, we should consider prices of $50 - $100 as not only possible in 2017 but a near certainty by 2019 – 2022.
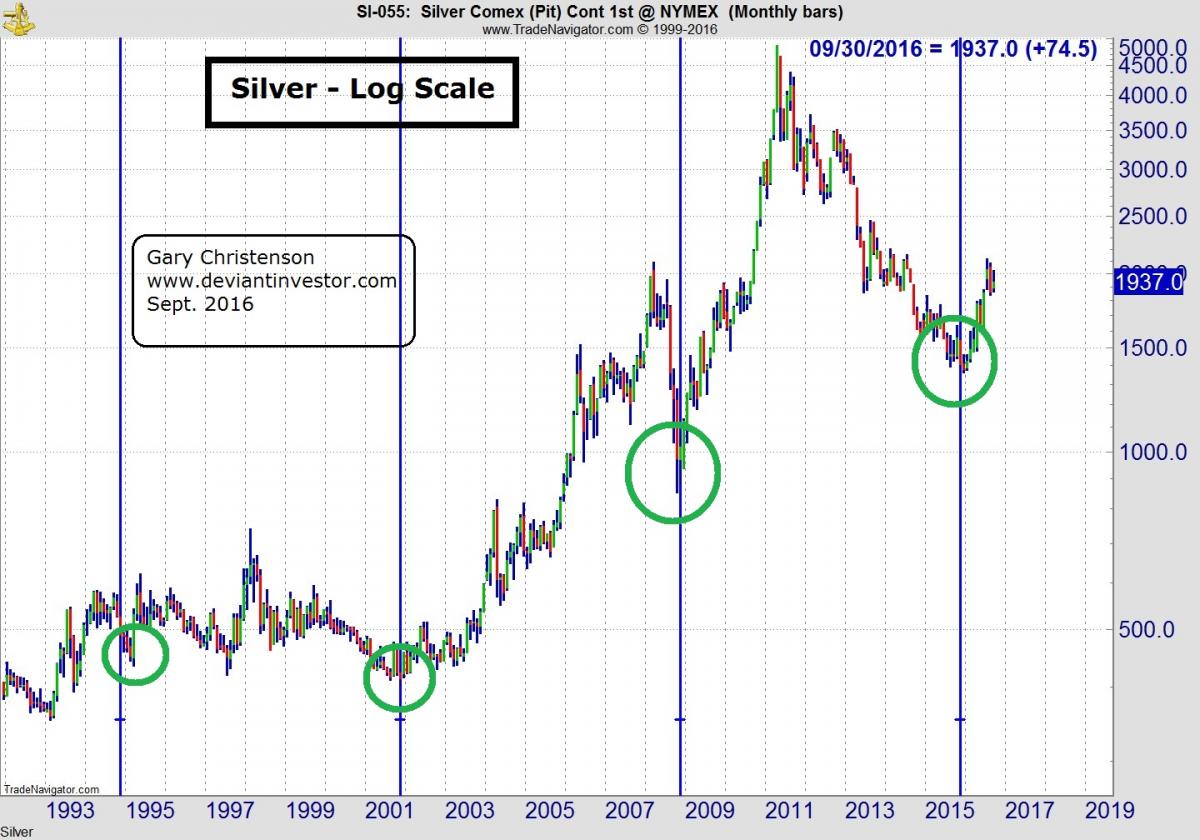
Silver Cycles
Cycles are slippery but consider the following chart which shows that silver reached lows in 1994-5, 2001, 2008, and 2017, about every seven years. The vertical lines on the chart below are spaced every 84 months. Note that silver bottomed in December 2015 and the next bottom is not due until about 2022-23.
What Else?
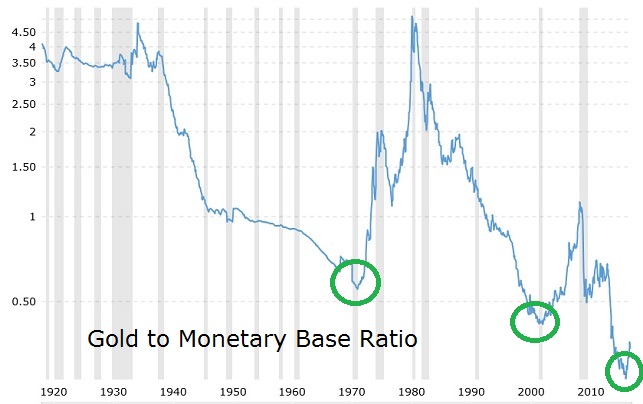
Our central bankers and commercial bankers, thanks to fractional reserve banking, excessive debt creation, shadow banking, QE, bailouts, and more have created a great many digital dollars. The Price of gold (similar to silver) versus the monetary base shows how low the price of gold (silver) is compared to the zillions of digital currency units created by banks. Consider the following chart (unknown source).
What Else?
From Another Interview With Silver Guru Ted Butler
The facts surrounding silver have never been more bullish.”
“In only a few years, JPMorgan has accumulated the largest hoard of silver in the history of the world.” [… physical silver, not the paper stuff…]
“A price rise is inevitable.”
“Imagine silver as a poker game. The stakes are in the billions. JPMorgan is holding an ace, king high royal flush. It’s a lock so they can’t lose. Everybody else at the table has four of a kind or a full house. JPMorgan is in no hurry to win the pot.
Could Silver Be Winding Up for a Big Move?
This spring, gold vastly outperformed silver, leaving the white metal looking for direction. The silver chart shows prices winding up within a huge wedge pattern.
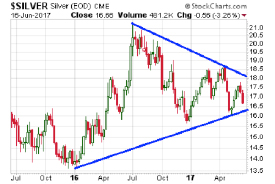
As the trading range gets narrower and narrower, it sets up a resolution in the form of a very strong directional move one way or the other.
A few more weeks of consolidation are still possible before a decisive break out from the pattern.
In 2016, silver was very strong in the first half of the year and weak in the second half. The first half of 2017 has been something of a wash, setting up something potentially big in the back half of the year.
CONCLUSIONS – Continued
- Politicians and central bankers will promote failed policies while devaluing fiat currencies which will push silver prices much higher. Expect $30 in 2017 and $50 if one or more implosions occur. Physical prices may be far higher than paper prices. Which makes it the right time to buy silver now before those prices rise.
- Long-term silver cycles indicate the market bottomed in late 2015 and should rise for another three to five years.
- Assuming Ted Butler is correct JPMorgan will stimulate the coming substantial rise in silver prices, NOT for our benefit, but for the benefit of JPMorgan and their management bonuses.
- $50 silver may not happen in 2017…but it certainly is NOT unlikely. $100 silver seems inevitable in a few years unless US politicians reduce spending by at least one-third, slowly repay the national debt, abolish the Federal Reserve, reduce military expenses, and face the voters during a massive depression. Nope, political change and a return to monetary sanity are not likely, but $100 silver – before the next cycle low in 2022 - 23 – is quite likely. Hyperinflation of the US dollar, should bankers and politicians choose that road, will accelerate price increases and push silver values to unimaginable levels.

About the Author:
Gary Christenson is the owner and writer for the popular and contrarian investment site Deviant Investor and the author of several books, including Fort Knox Down! and Gold Value and Gold Prices 1971 – 2021. He is a retired accountant and business manager with 30 years of experience studying markets, investing, and trading. He writes about investing, gold, silver, the economy, and central banking.
