The largest primary silver mine in the world experienced a huge decline in its production due to falling ore grades. The Cannington Mine, now run by South 32 Ltd., suffered a huge drop in its silver production during its 1H 2017 reporting period. Some companies, such as South 32, start their fiscal new year in July. BHP Billiton, who owned the Cannington mine since its start-up in 1997, spun it off to South 32 back in 2015.
According to South 32’s production report, the Cannington Mine saw its silver production drop by a staggering 27% in 1H 2017 versus 1H 2016:
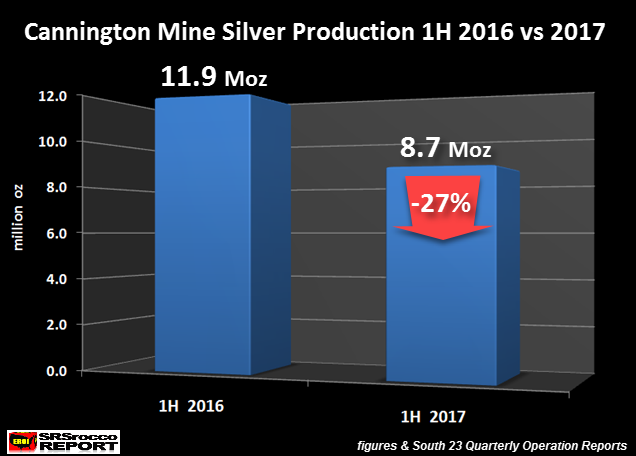
Silver Production at the Cannington Mine
Declined from 11.9 million oz (Moz) 1H 2016 to 8.7 Moz 1H 2017. These figures are comparing production from July-Dec 2015 versus July-Dec 2016. Again, the latter reporting period is stated as the first half of 2017 (1H 2017).
Regardless, this is a huge drop in silver production from the world’s largest primary silver mine located in Australia. Here is the actual table from the South 32 report:
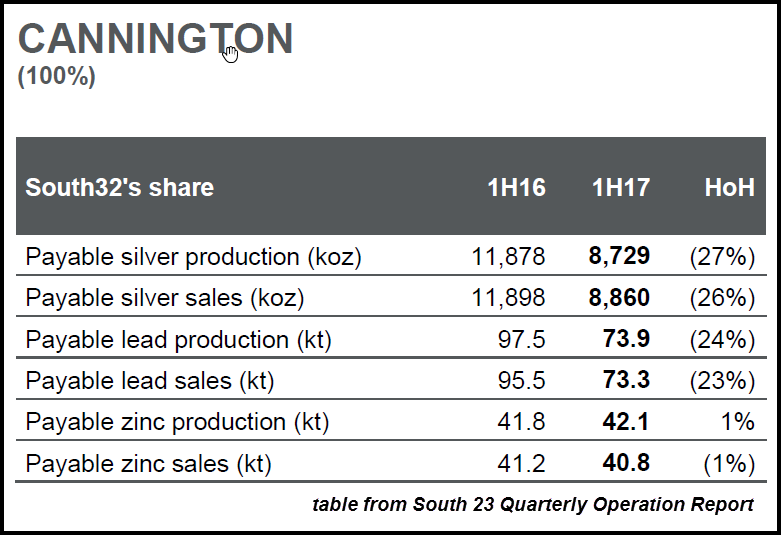
The reason for the big drop in silver production at Cannington was due to the huge decline in the silver ore grade at the mine. The average silver ore grade fell from 266 grams per tonne (g/t) in 1H 2016 to 198 g/t in 1H 2017. Falling silver ore grades are nothing new for Cannington, as it has been going on for quite some time. The world’s largest primary silver mine once produced silver at an average ore grade of 636 g/t… more than three times its current silver grade.
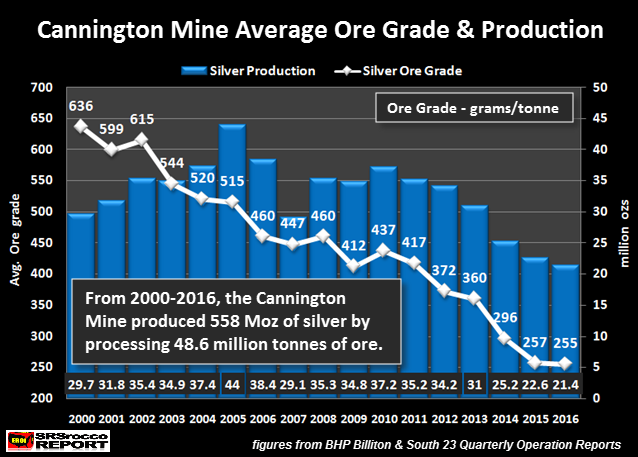
Here we can see that Cannington’s average silver ore grade declined from 636 g/t in 2000, to a low of 255 g/t in 2016. During its peak year in 2005, Cannington produced 44 Moz of silver at an average ore grade of 515 g/t. This single mine produced more than half a billion ounces (558 Moz) of silver since 2000.
The chart above was one of 48 published in my THE SILVER CHART REPORT. If you haven’t checked out the report, there is a lot of excellent information on the Silver Market and Industry not found in any other single publication on the internet.
The Silver Chart Report is a collection of my top silver charts from articles published over the past six years and includes in-depth, never-before-seen charts and content that indicate that silver is on the rise. There are 48 charts in the report, broken down into five sections:
- Silver Production
- Mining & Falling Ore Grades
- Official Silver Coin Sales
- Silver Price
- The Silver Market
The charts in these five sections give the investor a broad background of the silver industry and market. Silver will likely be one of the most sought-after physical assets in the future. Why? Several factors will impact its price (value) in the future, and they are explained thoroughly in The Silver Chart Report.
Even though production has continued to decline at Cannington, it was still the largest primary silver mine in 2015:
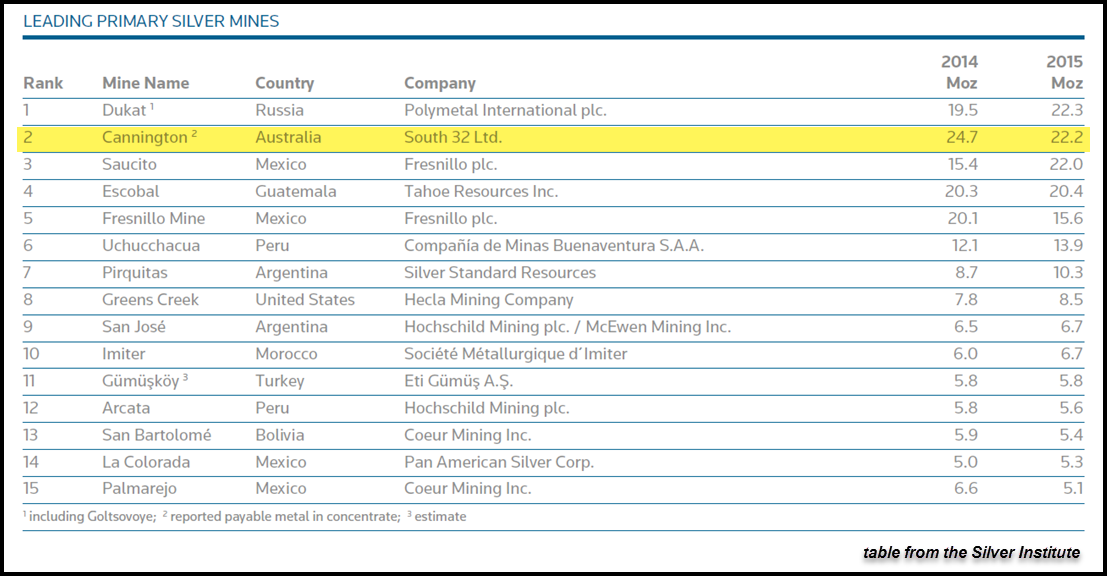
This table from the Silver Institute shows that the Cannington Mine ranked second in 2015, behind Polymetal’s Dukat Mine in Russia. However, revised data shows that the Cannington Mine produced 22.6 Moz of silver in 2015, not 22.2 Moz. So, when the Silver Institute publishes its updated primary silver mine data for 2016, it will put Cannington in the number one spot for 2015.
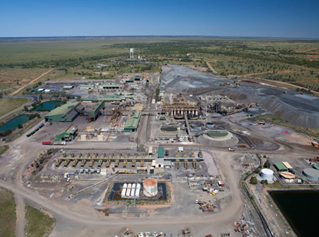
(Cannington Mine, North-west Queensland, Australia)
That being said, Cannington will fall to the number two spot in 2016, when all the data is finally released. According to the data released by the mining companies, here are the production results for 2016:
Top Four Primary Silver Mine Production In 2016:
- Fresnillo’s Saucito Mine = 21.9 Moz
- South 32’s Cannington Mine = 21.4 Moz
- Tahoe’s Escobal Mine = 21.3 Moz
- Polymetal’s Dukat = 19.3 Moz
Regardless, to see silver production fall 27% at the Cannington is quite amazing when we know its tremendous production history. South 23 states that the Cannington Mine will extract higher-grade silver ores in the second half of the year, but production is estimated to only reach 19 Moz for the year.
When U.S. and global oil production starts to decline in a BIG WAY, silver production will feel it the most. Why? Because by-product silver supply from copper, zinc, and lead production will fall precipitously as base metal demand plummets during the next financial and economic crisis.
The best time to invest in physical silver is before supply evaporates or before its price or value heads towards Jupiter.

About the Author:
Independent researcher Steve St. Angelo started to invest in precious metals in 2002. In 2008, he began researching areas of the gold and silver market that the majority of the precious metal analyst community has left unexplored. These areas include how energy and the falling EROI – Energy Returned On Invested – stand to impact the mining industry, precious metals, paper assets, and the overall economy.
