As the stock market continues to rise on the back of some of the worst geopolitical, financial, and domestic news, the U.S. Treasury has been quietly increasing the amount of government debt, with virtually no coverage by the Mainstream or Alternative Media. So, how much has the U.S. debt increased in the past few days? A bunch.
The surge in U.S. debt that took place over the past two days all started when the debt ceiling limit was officially allowed to increase on Sept 8th. In just one day, the U.S. Treasury increased the public debt by $318 billion:
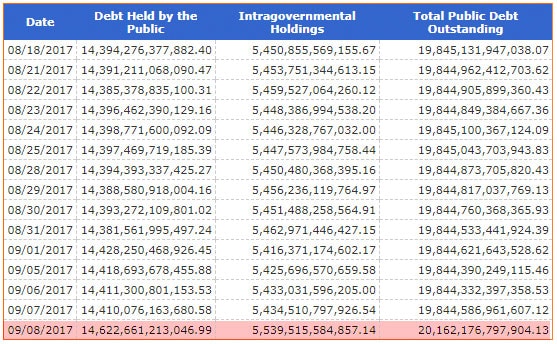
(chart courtesy of TreasuryDirect.gov)
This was the first time in U.S. history that the public debt rose over $20 trillion. I mentioned this in my article, The U.S. Government Massive ONE-DAY Debt Increase Impact On Interest Expense & Silver ETF:
Thus, when the U.S. Treasury increased the public debt by $318 billion, it will also have to pay an additional $7 billion in annual interest payments to finance that debt. However, that large one-day debt increase was over three weeks ago. What’s been going on at the U.S. Treasury since then? Let’s just say; they have been very busy… LOL.
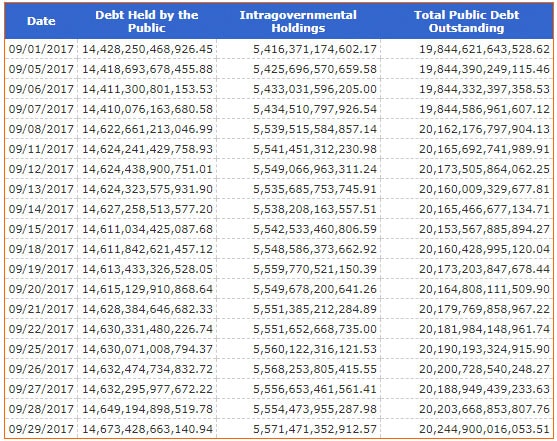
On the last update in September, the U.S. Treasury increased the debt by nearly $40 billion on the very last day of the month:
(chart courtesy of TreasuryDirect.gov)
As we can see, the U.S. public debt increased from $20,203 billion ($20.203 trillion) on Sept. 28th to $20,245 billion on Sept 29th. Overall, the U.S. debt increased $83 billion more since the $318 billion one-day increase on Sept 8th. This means the total debt increase was $400 billion in a little more than three weeks. However, the U.S. Government must be making up for lost time when the debt ceiling was frozen from March 15th to Sept 7th.
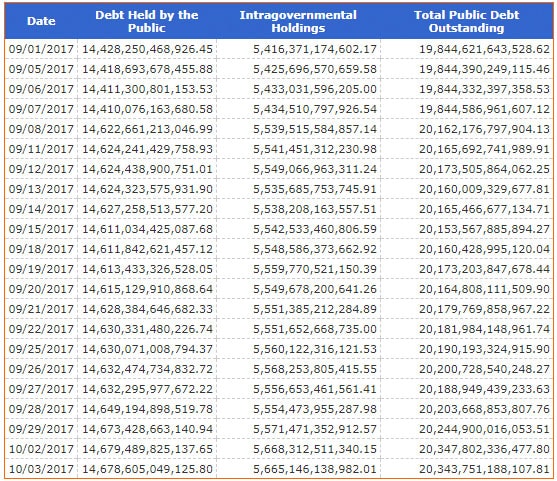
According to the TreasuryDirect.gov website, the U.S. public debt ballooned by another $100 billion in the first two days of October:
(chart courtesy of TreasuryDirect.gov)
Alright, it only increased by $99 billion from $20,445 billion to $20,344 billion, but I’d rather use $100 billion because it has a better ring to it. So, in less than a month, the U.S. Government's public debt increased by a stunning $500 billion. Along with the half trillion Dollars worth of new public debt, the U.S. Treasury will have to pay an additional $11 billion a year in interest payments based on an average 2.2% rate.
The notion that the Fed will continue to increase interest rates and begin to liquidate its inventory of MBS – Mortgaged Backed Securities that no one wanted in 2009-2010, as well as some of its high-quality Treasury toilet paper, is pure bollocks when they are handing out money hand over fist. As I mentioned in my article linked above, if the interest rate went back to the 6.4% rate as it was in 2000, the U.S. Treasury interest on the debt would surge to more than $1.3 trillion.
Thus, our annual interest payment of $1.3 trillion (based on a 6.4% average interest rate) would account for one-third of the $3.9 trillion 2016 budget. Of course, this could not fly as our annual deficit would jump from $587 billion (2016) to $1.4 trillion. I believe we are going to see a $1+ trillion annual deficit in the next several years.
It is impressive to see how quickly the U.S. Treasury is increasing the public debt:
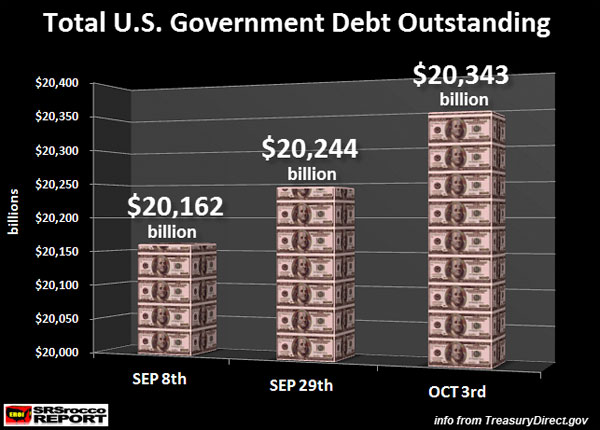
Again, this additional $182 debt increase comes after the $318 billion one-day increase on Sept 8th. No wonder, China and Russia are working together on an alternative Gold-Backed Yuan Oil trading benchmark as highlighted in the article, A Failing Empire, Part 2: De-Dollarisation – China and Russia’s Plan From Petroyuan To Gold:
For China, Iran, and Russia, as well as other countries, de-dollarization has become a pressing issue.
The number of countries that are beginning to see the benefits of a decentralized system, as opposed to the US dollar system, is increasing.
- Iran and India, but also Iran and Russia, have often traded hydrocarbons in exchange for primary goods, thereby bypassing American sanctions.
- Likewise, China’s economic power has allowed it to open a 10-billion-euro line of credit to Iran to circumvent recent sanctions.
- Even the DPRK seems to use cryptocurrencies like Bitcoin to buy oil from China and bypass US sanctions.
- Venezuela (with the largest oil reserves in the world) has just started a historic move to completely renounce selling oil in dollars and has announced that it will start receiving money in a basket of currencies without US dollars. (This is not to mention the biggest change to have occurred in the last 40 years).
- Beijing will buy gas and oil from Russia by paying in yuan, with Moscow being able to convert yuan into gold immediately thanks to the Shanghai International Energy Exchange.
As the U.S. Treasury and Federal Government continue printing money and increasing its debt by $500 billion at a clip, the rest of the world is no longer going to sit around and wait for the negative ramifications.
Lastly, I have one more interesting chart to share before I conclude this article. I find it quite ironic (HILARIOUS) that the gold and silver price PEAKED on the very same day the debt ceiling was increased and another $318 billion of debt was added to the U.S. Govt balance sheet while the Dow Jones Index bottomed and surged by 1,000+ points:
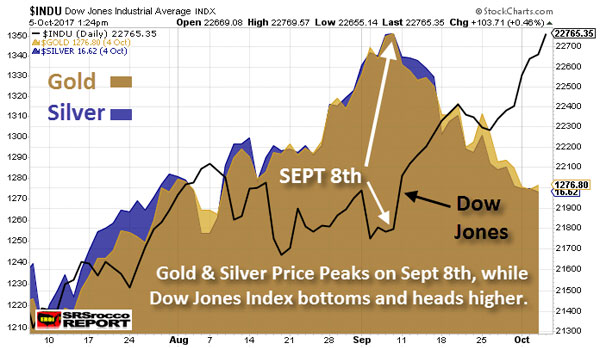
I gather this chart wraps up the situation nicely. As the U.S. Govt pumps up the market with another $500 billion in debt, the stock market continues to move into BUBBLE TERRITORY. Unfortunately, precious metals investors have to be patient until the Fed and U.S. Treasury completely BLOW UP the market.

About the Author:
Independent researcher Steve St. Angelo started to invest in precious metals in 2002. In 2008, he began researching areas of the gold and silver market that the majority of the precious metal analyst community has left unexplored. These areas include how energy and the falling EROI – Energy Returned On Invested – stand to impact the mining industry, precious metals, paper assets, and the overall economy.


