
The rate at which global silver production increased over the past century is quite astonishing. When Columbus arrived in America (1492), the world was only producing 7 million oz of silver a year. Today, the world’s largest primary silver mine, Fresnillo’s Sauicto Mine, produced three times that amount in just one year (22 million oz, 2016). Yes, we have come a long way in 500 years.
Just think about that for a minute. One silver mine last year produced three times the global amount in 1493. According to the U.S. Bureau of Mines 1930 Report on Summarized Data of Silver Production, the average annual silver production in the world from 1493 to 1600 was 6.9 million oz (Moz). If we look at the following chart, we can see how world silver production increased over the past 500+ years:
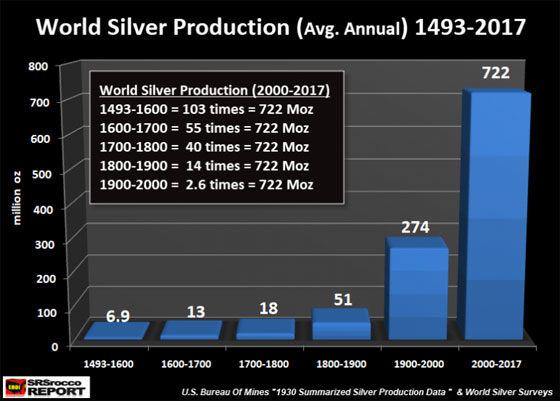
As we can see, average annual world silver production increased from 6.9 Moz during 1493-1600, to 13 Moz from 1600-1700, 18 Moz from 1700-1800, 51 Moz from 1800-1900, 274 Moz from 1900-2000, and stunning 722 Moz from 2000-2017. Again, these figures represent the average annual silver production for each period.
In the current period, 2000-2017, the world has produced 103 times more silver per year than from 1493-1600. However, the next chart shows the total silver production for each period. From 1493-1600, the world produced a total of 747 Moz of silver, compared to 13,000 Moz (13 billion oz) in just 18 years from 2000-2017:
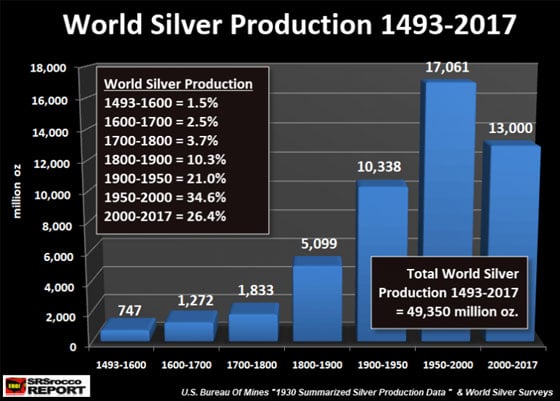
Now, the reason the last silver bar on the right of the chart is lower than the previous one has to do with comparing 18 years' worth of silver production (2000-2017) versus 50 years (1950-2000). It took 50 years to produce 17,061 Moz during 1950-2000 versus 13,000 Moz in the 18 years from 2000-2017.
If we compare world silver production from the different periods, here is the result:
Percentage Of World Silver Production (1493-2017)
2000-2017 = 26.4%
1950-2017 = 61%
1900-2017 = 82%
While a little more than a quarter of all world silver production (1493-2017) was produced in the past 18 years, 82% were produced since 1900. That is a lot of silver. It turns out that 40.4 billion oz was produced from 1900-2017 out of the total 49.3 billion oz produced since 1493. Interestingly, more than half of that silver was consumed in industrial silver applications. I will be writing more about that in future articles.
The last chart I find quite interesting. If we go back a little more than a century, the United States was the largest silver producer in the world. In 1915, the U.S. produced 75 Moz of silver out of the total 189 Moz mined in the world that year:
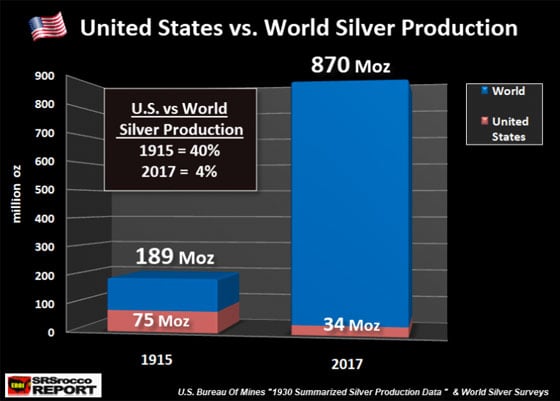
Thus, in 1915, the U.S. produced 40% of all world silver production. Mexico came in second in 1915 by producing 39.3 Moz. However, U.S. silver production in 2017 will only be 34 Moz versus the estimated 870 Moz globally. Thus, U.S. silver production only accounts for 4% of the world mine supply versus 40% back in 1915. What a change in 100 years.
Lastly, the U.S. imports approximately 22% of world mine production each year. That is 193 Moz of the total 870 Moz in 2017. While domestic mine supply is only 34 Moz, the United States has to import more than a fifth of global mine production to meet its silver market demand.

About the Author:
Independent researcher Steve St. Angelo started to invest in precious metals in 2002. In 2008, he began researching areas of the gold and silver market that the majority of the precious metal analyst community has left unexplored. These areas include how energy and the falling EROI – Energy Returned On Invested – stand to impact the mining industry, precious metals, paper assets, and the overall economy.
