As the Dow Jones Index continues to drop like a rock, the worst is yet to come. Today, investors once again plowed into the markets because they are following the Mainstream Financial advice of BUYING THE DIP. Unfortunately, those who bought the dip before yesterday’s 1,032-point drop and the 400+ point drop this afternoon, have thrown good money after bad.
Of course, we could see a late-day rally to calm investors’ nerves…. but we could also see an increased sell-off. Either way, I could give a rat’s arse. Why? Well, let’s just say the Dow Jones Index has a long way to fall before it gets back to FAIR VALUE. However, my fair value is likely much lower than the Mainstream analysts’ forecasts.
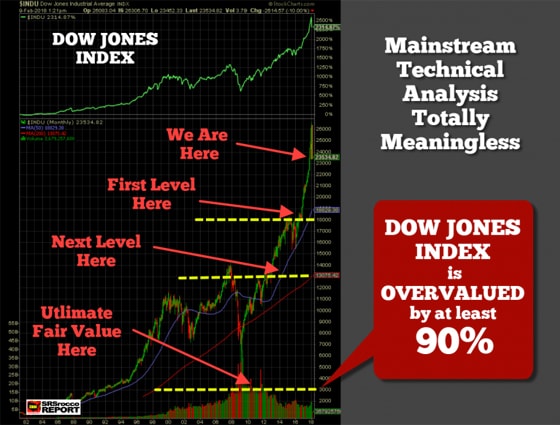
I wanted to publish this post today but will be putting together a Youtube video with more detail this weekend. However, let’s take a look at the Dow Jones Index chart from my Youtube video:
If you haven’t seen this video, I highly recommend that you do. When I published that video, the Dow Jones Index was trading at 26,100. Today it is already down to 23,400. However, as I stated, we have much further down to go. Here is my newest chart:
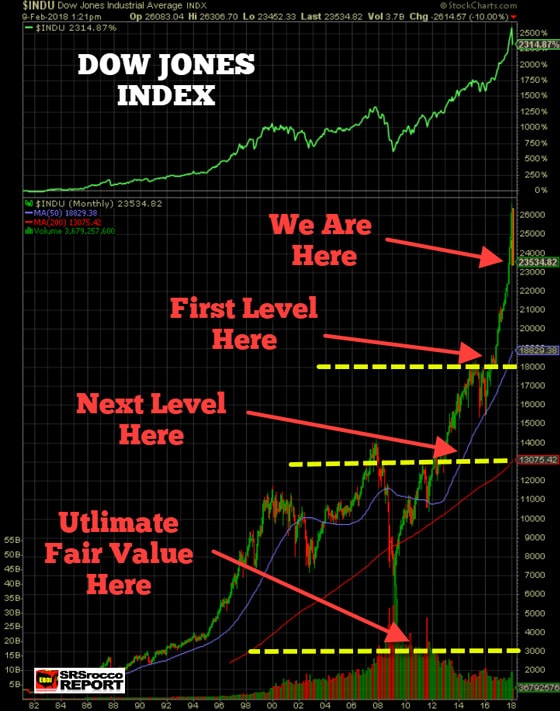
While the Dow Jones Index has already declined by 2,500 points since my first chart, I wanted to provide the different correction and crash levels as I see it taking place on the Dow Jones Index in the future. The first level the Dow Jones will reach its Support level at about 18,000 points. Once this level is broken, then it breaks down to the 200 Month Moving Average (RED line) at 13,000. Who knows how long it would take to get down to 13,000, but it will.
As you can see, the Dow Jones Index fell below its 200 Month Moving Average in 2009, so this isn’t anything new.
However, the ULTIMATE FAIR VALUE for the Dow Jones Index when we factor in the Dire Energy Predicament is about 3,000 points:
I will discuss this in the next video. Happy Trading to the POOR SLOBS who continue to throw money in this market.

About the Author:
Independent researcher Steve St. Angelo started to invest in precious metals in 2002. In 2008, he began researching areas of the gold and silver market that the majority of the precious metal analyst community has left unexplored. These areas include how energy and the falling EROI – Energy Returned On Invested – stand to impact the mining industry, precious metals, paper assets, and the overall economy.
