How much gold did the two largest mining countries produce in history? Well, let’s just say that precious metals investors would be quite surprised to learn that the total cumulative gold production from the two leading countries is well over two billion ounces. That is one heck of a lot of gold once we consider that only six billion oz of gold has been mined in recorded history.
Here are a few clues on the top two gold-producing countries. The country that produced the most gold in history experienced peak production in 1970 while the second largest topped out in 1998. Interestingly, the largest gold-producing country mined 1,000 metric tons (mt) of gold in 1970, and only one other nation has come close to supplying less than half of that amount in a year.
According to the data from several sources, South Africa is the number one gold producer in the world supplying nearly 1.7 billion oz of gold since 1871. South African gold production started slow at no more than 5,500 oz per year in the early 1870s, but by 1896, the country was mining more than 2.5 million oz (Moz) of the shiny yellow metal annually. It is no wonder the British Empire decided to take over control of the Transvaal Colony in South Africa from the Dutch Boers.
From the article titled, British Takeover Of South Africa (Part 1), here is the following chronology of how the Rothschilds controlled the international gold sector via the British Empire:
Mid 1880s – Gold is discovered in the Transvaal, triggering the gold rush. Unlike many other newly-discovered gold areas, South Africa did not need to borrow from the Rothschild banks to fund these ventures. Rather, the profit from the diamond fields helped to fund the gold mines in the Transvaal. And since the British had annexed the Transvaal, and like diamonds, the Rothschilds controlled the international gold sector, even establishing the daily price of gold at N.M. Rothschild and Sons, in London. In essence, both the diamond and gold sectors came under British/Rothschild control from the onset. South Africa was becoming of increasing importance within the Rothschild/British Empire.
The Boers still controlled the Transvaal, and the British aimed to wrest political control away from the Boers. London gave instructions to effect a military takeover of the Transvaal.
1899 – British troops gather on the Transvaal border and ignore an ultimatum to disperse. The second Anglo-Boer War begins.
1902 – Treaty of Vereeniging ends the Second Anglo-Boer War. The Transvaal and Orange Free State are made self-governing colonies of the British Empire.
Twenty-five years after the Rothschilds and British Empire took control over South Africa (1902), the country was producing more than 50% of the world’s annual gold supply at 10+ Moz. Interestingly, South Africa was producing more gold in 1927 than Australia mined last year (9.5 Moz)… the world’s second-largest gold producer in 2017.
Now that we know that South Africa was the world’s largest gold producer in history, which country came in second? The next largest gold mining country came in a distant second by producing only a third of South Africa’s 52,700 mt. The United States ranked second in the world by mining 18,800 mt of gold since 1801:
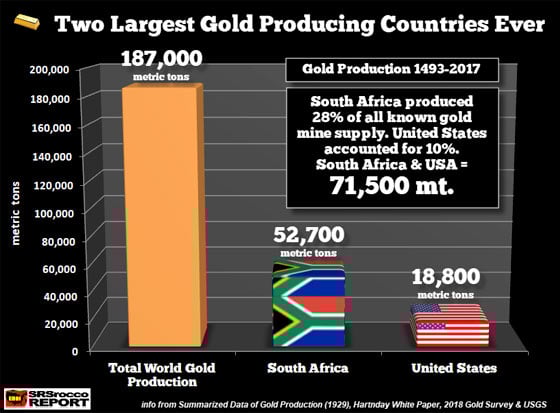
Thus, South Africa and the U.S. produced 71,500 mt of gold or 38% of the known global mine supply. Excluding the former U.S.S.R. and Russia, the country ranked third in cumulative gold production in Australia:
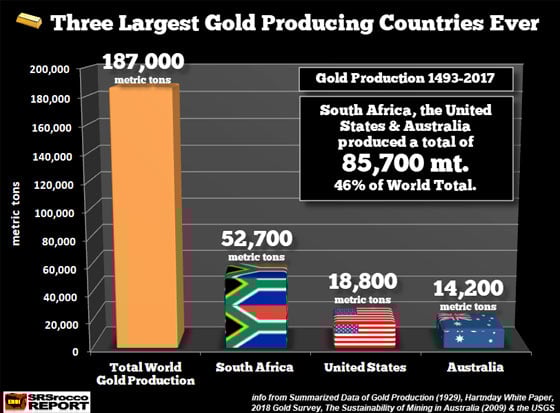
According to the data from “The Sustainability of Mining In Australia,” cumulative gold production in Australia from 1851-2007 was 11,565 mt plus 2,610 mt mined during 2008-2017 (GFMS 2018 World Gold Survey).
Now, the reason I excluded the former U.S.S.R. and Russia has to do with the incomplete and questionable data provided by these two countries. However, the “Summarized Data on Gold Production,” published by the U.S. Bureau of Mines in 1929, estimated that Russia produced a total of 89 Moz of gold from 1801-1927. Compared to the other top gold producers, we have the following:
1801-1927 Cumulative Gold Production
Transvaal, South Africa = 219 Moz
The United States = 214 Moz
Australia = 147 Moz
Russia = 89 Moz
In researching the data put out by the CIA in their “Soviet Gold Production, Reserves & Exports Through 1954,”, mine supply increased significantly in the former U.S.S.R during the 1930s and after WW2. However, after the collapse of the Soviet Union in 1989, gold production fell sharply.
Regardless, even if all the gold production data was made public by Russia, I doubt their cumulative gold production would surpass the United States. However, total cumulative Russian gold production could be more than Australia, if the actual data was available.
To give you an idea of just how much gold these top-producing countries mined in troy ounces, take a look at the following chart:
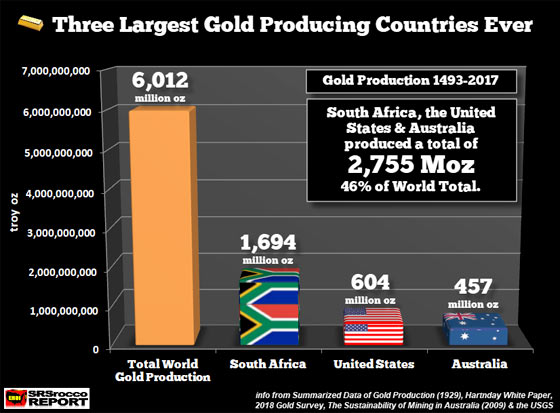
South Africa mined 1,694 Moz while the U.S. produced 604 Moz and Australia 457 Moz. The total of these three countries is 2.7 billion oz or nearly half of the total cumulative global gold mine production. Just think about this for a minute. Of the 32,600 metric tons or 1.05 billion oz of current World Central Bank gold reserves, South Africa’s production accounted for more than one and a half times this amount.
Moreover, even though South Africa minted a large number of Gold Krugerrands over the past 50 years, the majority of its gold made its way into the market. According to the data from GoldBarsWorldWide.com, there was 51 million oz of Gold Krugerrands minted from 1967 to 2013. If we include the data for 2014-2017 (GFMS World Gold Survey), the total Gold Krugerrands coined are probably 54+ million oz.
The peak year of Gold Krugerrands was in 1978 when the South African Mint produced over 6 million oz. However, the country’s total gold production that year was 22.6 Moz. Thus, South Africa was supplying nearly 75% of its domestic gold mine supply to the market while 25% went to the minting of Gold Krugerrands. More recently, in 2013, South Africa mined 5.5 Moz of gold and only minted 862,000 oz of Gold Krugerrands. This means, 84% of South African gold was available to the market in 2013 while 16% went to the production of Gold Krugerrands.
When I did the research, I knew that South Africa was likely the largest gold producer in history, but I was surprised to find out that one country, actually one small mining area, produced more than a quarter of all the world’s gold. Even the mighty California Gold Rush from 1848-1888 only produced 55 Moz of gold.
While the U.S. produced a lot of gold in the late 1800s and early 1900s, its peak production was in 1998 at 11.8 Moz. In the past 20 years, the United States produced nearly 5,500 mt of gold (175 Moz), or nearly 30% of all domestic mine supply since 1801.
Unfortunately, only a very small percentage of investors have acquired gold and silver. I imagine the number is now less than 1%. While some in the Alternative Media Community believe this was a “Grand Conspiracy” by the elite, I rather think it was due to the wealthy’s drive for profits and the public’s desire for more goods and services than they could afford.
We must remember, most people would rather buy and use a nice car, boat, RV, and loads of high-tech gadgets than buy a lump of gold or silver just to look at it. The public is “under-insured” and “over-burdened with gobs of stuff and crap.” Now, when I say, underinsured, I am not referring to just health care, but including all aspects of being prepared for HARD TIMES ahead.
Most Americans would rather spend their surplus funds on THINGS to use and do than on protecting their family when the SHYTE HITS THE FAN.

About the Author:
Independent researcher Steve St. Angelo started to invest in precious metals in 2002. In 2008, he began researching areas of the gold and silver market that the majority of the precious metal analyst community has left unexplored. These areas include how energy and the falling EROI – Energy Returned On Invested – stand to impact the mining industry, precious metals, paper assets, and the overall economy.
