
While the silver price has broken above the symmetrical triangle formation, it still has a few key levels to surpass to continue its upward trend. However, it was crucial for silver to first break above rather than below the symmetrical triangle to be able to remain in a bullish direction.
So, we have to take one positive silver price action at a time and look at the next technical levels. First, we can see that silver broke upward above the Symmetrical Triangle formation:
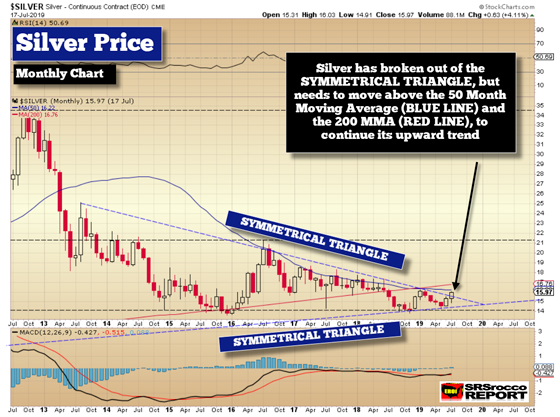
We must remember, silver needs to close above the upper Symmetrical Triangle line by the end of July for it to be a Breakout. If you look at the monthly candlesticks in July & August 2016 (chart below), while silver shot above the blue dashed line, it did not close above it. The silver price closed at the end of July & August 2016 right at the upper Symmetrical Triangle formation line.
Second, if silver can close above this upper Symmetrical Triangle line by the end of July, it would also have to push above the 50 Month Moving Average (MMA @ $16.22), shown in the chart below:
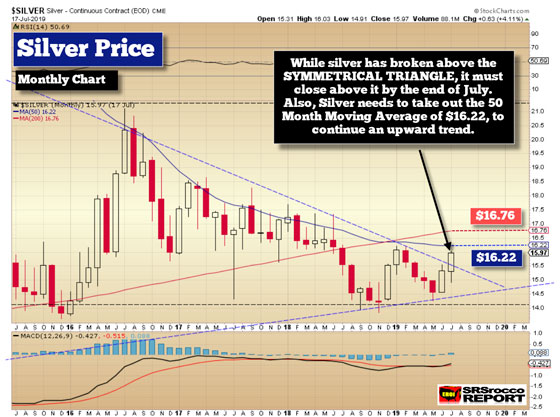
If you look at both charts, the silver price has not closed above the 50 MMA (BLUE LINE) since early 2013. Furthermore, each time silver tried to surpass the 50 MMA since 2016, it closed below it. So, the next important key level for silver is the 50 MMA at $16.22. It would need to close above this level for a bullish trend to remain.
And, once silver can close above the $16.22 (50 MMA) level, it will need to break the 200 Month Moving Average (RED LINE) of $16.76. These are the two next important levels for silver to close above, ON A MONTHLY BASIS. Thus, silver needs to close at the end of July or August above these levels to be able to reach the next MAJOR KEY BREAKOUT LEVEL of $21.35-$21.50.
AFTER-HOURS UPDATE: Both silver and gold looked strong today as both closed nicely higher today. Silver also surpassed the next important key level, the 50 Month Moving Average at $16.22, and Gold was up $20 today. We could be finally seeing the next leg of the Gold-Silver Bull Market after a 5-year consolidation phase.
However, the metals could experience a pullback first. We just have to wait and see what happens over the next 10 days of trading, as both gold and silver close above these key levels at the end of the month.
While the technical levels that I have mentioned in both Gold and Silver bring in more traders, investors, hedge funds, and institutional buying, it was due to the fundamentals of FED SOFTENING on its monetary policy that were the underlying cause. The Fed changed its monetary policy to lowering interest rates and cutting back on its balance sheet liquidation, that was all that was needed to give the much-needed PUSH above those KEY LEVELS.

About the Author:
Independent researcher Steve St. Angelo started to invest in precious metals in 2002. In 2008, he began researching areas of the gold and silver market that the majority of the precious metal analyst community has left unexplored. These areas include how energy and the falling EROI – Energy Returned On Invested – stand to impact the mining industry, precious metals, paper assets, and the overall economy.
