Harry Dent says gold is in a bubble, and according to his analysis, warns that it could go back down to $700. If the gold price were to crash lower to $700, as Dent forecasts, then 50+% of the gold mining industry would have to shut down. Why? Because the top gold miners' total cost of production is now above $1,200 an ounce.
Of course, Harry Dent doesn’t take into consideration what it cost to produce gold as he pays no attention to the impact of ENERGY on the market. He, like many analysts, must believe that gold comes from the Tooth Fairy. And, maybe we can’t blame them as the world has taken energy for granted. Unfortunately, the overwhelming majority of economists and financial analysts do not incorporate energy into their forecasts. Thus, most of the market analysis today is seriously flawed.
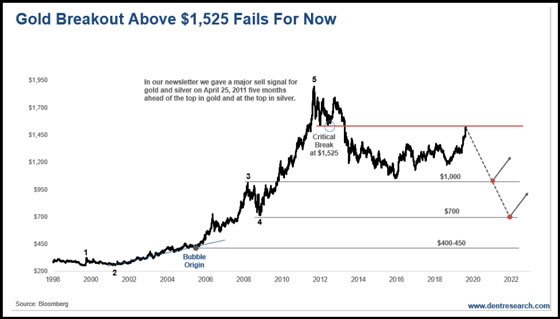
Let me start with Harry Dent’s newest article, Gold Fails Bullish Breakout… Stocks Likely to Breakout Instead. Dent provides the following chart and analysis:
(chart from Dentresearch.com)
Gold’s Bad Break
Peter Schiff – who is also living in Puerto Rico – emailed me recently and asked when I would turn more bullish on gold. My answer was $1,525. I have been eyeing that as the key resistance. If pierced, gold would have substantially higher targets –$1,600 to as high as $1,800.
But Tuesday’s news caused gold to fall sharply just as the futures markets showed gold breaking up to $1,540+… that would have been a clear breakout. Is this the end for gold for now, or is this news transitory? These two reversals in gold and stocks look convincing for now, and bullish for stocks.
Dent conveniently shows in his chart that gold hasn’t broken above the $1,525 level, but failed to acknowledge the huge $165 BREAKOUT above the key 5-year resistance level of $1,360:
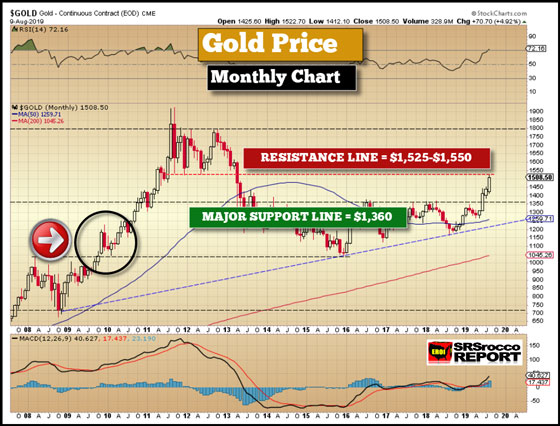
While Dent criticizes gold for not breaking through the $1,525 level, nothing goes up in a straight line. The gold price shot above the 5-year $1,360 resistance level, which is now the new support level, by $165 in less than two months. This is an excellent sign. Of course, gold would hit some resistance at the next technical level of $1,525. Thus, the gold price may need to consolidate a bit before moving higher. Dent should know this, but he also seems to be conveniently overlooking the fact that stocks and commodities tend to correct lower after a large breakout.
I explain this in detail in my newest YouTube video update: Gold & Silver Continued Summer Rally Or Correction.
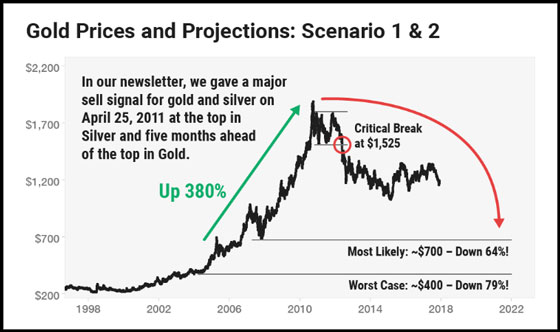
Regardless, Dent has been playing the ANTI-GOLD CARD for as long as I remember. In his newest Gold E-Book, called The Great Gold Bust Ahead, Dent provides an even lower worst-case level for gold of $400-450:
(chart from Dent’s The Great Gold Bust Ahead)
It seems that Dent is providing a “Worst Case” $400-$450 gold price because, that is where he suggests the “Gold Bubble” began. If we take a look at his most recent gold chart again, I would like to fill in some important MISSING KEY FACTORS that Dent is excluding from his analysis:
(chart from Dentresearch.com)
First, you will see in the chart 2005. This is where Dent labels the gold “Bubble Origin.” And, if we just looked at paper charts for our analysis, then maybe Dent would be on to something. However, these charts represent what is taking place in the REAL WORLD. So, if we want to understand better what the charts are showing us, we have to look at the main factor that drives the gold price and market… and that is ENERGY.
Secondly, the gold production cost has been a reliable driver of the gold price. As we can see in my new updated chart below, including Barrick and Newmont’s total gold production cost for Q2 2019, there’s a good reason the gold price hasn’t fallen to $700:
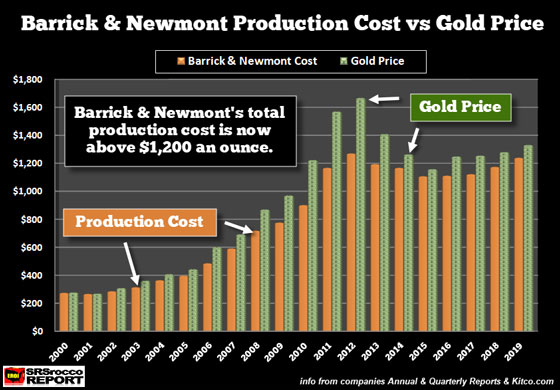
The total cost of production for Barrick and Newmont has ranged between an average $1,100-$1,200 over the past six years. Furthermore, my analysis suggests that Barrick and Newmont’s total Adjusted Income Breakeven is now over $1,200 an ounce.
Okay, some skeptics who don’t believe that the gold production cost provides a floor in the gold price, let me present this chart:
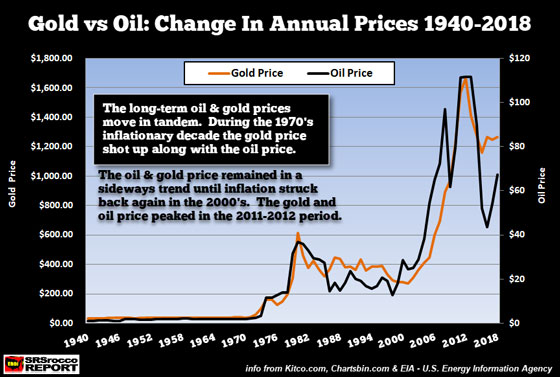
Some precious metals analysts suggest that “Supply & Demand” forces are the real drivers of the gold price. However, if we were to ignore all the supply and demand statistics, we can clearly see that the oil price has been the leading driver for the gold price since 1940, and beyond. Why? Because, the oil price dictates the cost it takes to produce an ounce of gold.
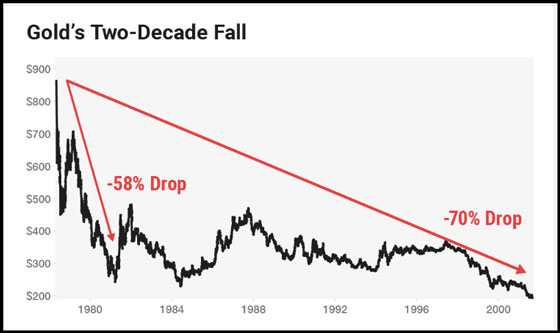
Sure, if there were no demand for gold on the entire planet, then, of course, the price would be zero, but that isn’t the argument here. Rather, Dent forecasts a lower gold price due to a coming recession, similar to what happened to the gold price during the 1980s. Dent also provides these two gold charts from his Gold E-Book promotional link:
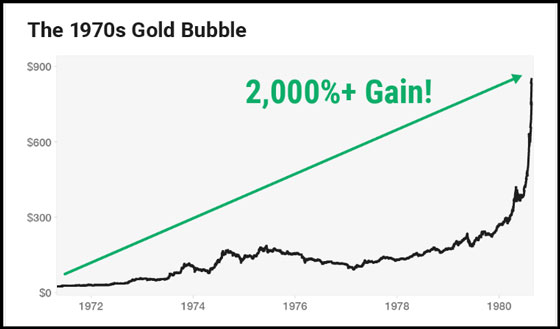
(chart from Dent’s Gold E-Book Promo Link)
Harry shows the 1970’s big gold bubble where it gained 2,000%. However, Dent failed to show that the oil price, which is the foundation of the price of most goods and services in the market, went up more than 1,500% during the 1970s. Please look at the following Gold-Oil price chart:
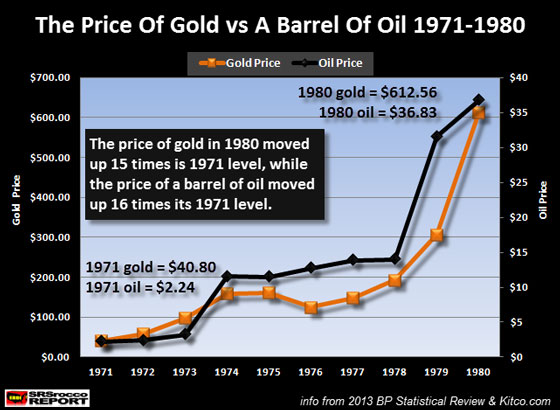
The gold price wasn’t in a BUBBLE has Dent stated, rather it was doing exactly what it was supposed to, protect investors and the public from inflationary prices. If we go by an annual average gold and oil price, not the absolute Gold Peak that Dent used to get his 2,000% gain, we have the following:
Oil & Gold Annual Average Price Change 1970-1980
Oil Price = 1544% (15 times higher)
Gold Price = 1401% (14 times higher)
So, if investors wanted to buy gold, they were going to have to pay much more money for it in the late 1970s because its production cost had also skyrocketed. Here is my chart of Homestake Mining and its cost of production from 1971 to 1979 (sorry, I did not have Homestake’s Annual Report data for 1970 or 1980):
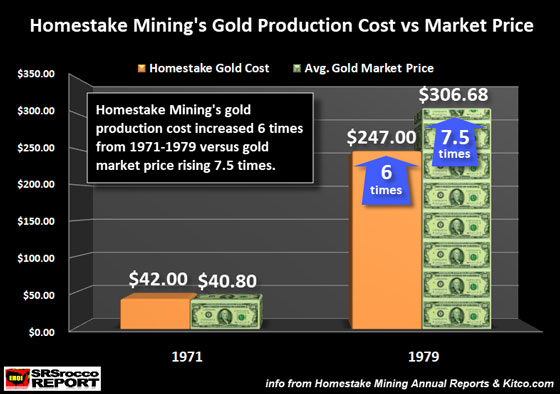
Homestake’s production cost increased six times by 1979 to $247 an ounce when the average annual market price for gold was $306. So, gold was clearly not in a bubble if we consider how the rising oil and energy prices impacted the production cost.
Now, it is true that gold fell from a peak annual price of $612 in 1980 to an average of $372 for the two decades 1981-2000, because the oil price had dropped to an average $21.77 for the same period. However, even though the gold price fell nearly 40% from its 1980 high to that $372 price level, it was still almost ten times higher than its price in 1970.
Harry Dent is making the same mistake with his analysis of gold today as he did for the 1970s. Gold fell to an average annual low of $1,160 in 2015, because the oil price had collapsed from over $100 down to $52. But, the reason gold continues to remain in the $1,200 range, even with lower oil prices, has to do with the fact that ore grades continue to decline in the industry and are now more than 20% less than they were in 2005. So, the gold mining industry has to extract and process 20+% more ore today to produce the same amount of gold. This takes a great deal more energy and money.
A perfect example of how falling ore grades impact the amount of ore extracted is Barrick’s largest gold mines in the United States. Barrick’s Goldstrike & Cortez Mines in Nevada have seen their average gold yield decline from 5.3 grams per ton (g/t) in 2003 to 3 g/t in 2017:
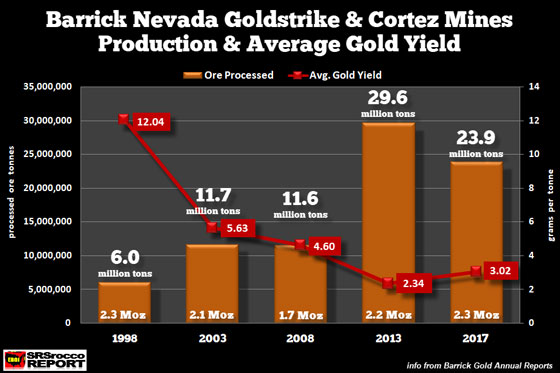
Barrick’s Goldstrike & Cortez Mines had to double their processed ore to nearly 24 million tons in 2017 to produce about the same amount of gold in 2003. Unfortunately, Dent and other analysts don’t pay attention to what is taking place in the gold mining industry.
Now, some mining analysts will disagree with the $1,200 total cost to produce gold. They will say that the ALL-IN-SUSTAINING-COST (AISC) is closer to $1,000 an ounce… according to data put out by MiningIntelligence.com. However, the AISC does not account for all costs and does not take into account the massive share dilution the mining companies have been forced to do to continue business as usual. The top five gold miners outstanding shares have increased from 1.3 billion shares in 2000 to 3.8 billion shares in 2018… nearly triple.
Yes, the gold mining industry could indeed continue to produce gold at $1,000, for a brief while. However, at $700 for an extended period, it would shut down 50+% of the industry.
While Harry Dent’s analysis on the changing U.S. and global demographics is quite interesting, he doesn’t consider the Energy or the Falling EROI – Energy Returned On Investment and how that will impact that value of most assets going forward. Harry seems to be guilty, as are many analysts, in believing in the ENERGY TOOTH FAIRY… abundant cheap energy forever.

About the Author:
Independent researcher Steve St. Angelo started to invest in precious metals in 2002. In 2008, he began researching areas of the gold and silver market that the majority of the precious metal analyst community has left unexplored. These areas include how energy and the falling EROI – Energy Returned On Invested – stand to impact the mining industry, precious metals, paper assets, and the overall economy.
