Gold and silver prices remain mired in weeks-long trading ranges. They are essentially moving sideways – for now.
Precious metals mining stocks, however, are moving up. The chart of the HUI gold miners index shows an uptrend in place since mid-October.
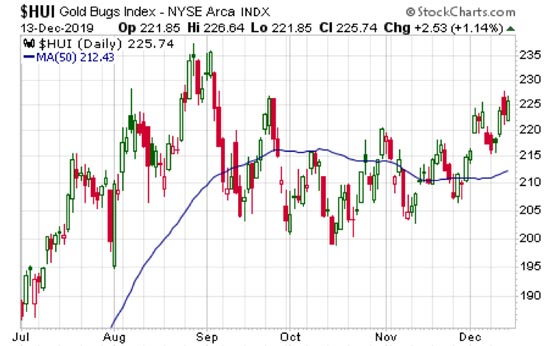
The HUI has traded above its 50-day moving average for several days in a row. The 50-day line itself is now also curling up, confirming underlying technical strength.
If the HUI is a leading indicator for spot gold (and it often is), then gold prices may be on the verge of also breaking out. Gold closed last Friday right at the 50-day moving average resistance.
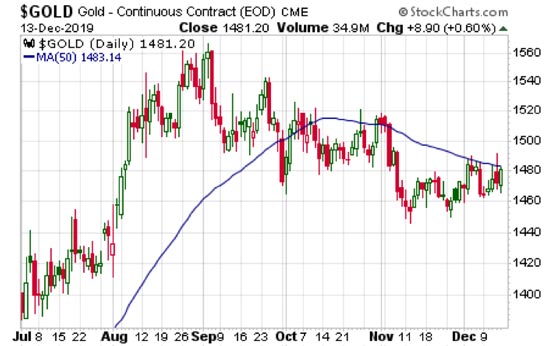
A couple of strong closes above the 50-day line should put gold on a pathway to an extended rally.
Silver, meanwhile, has been trading around the $17.00/oz level for the past five weeks and needs to break above $17.30, then $17.50, to get something going on the upside.
Bulls can take encouragement in the impressive outperformance of the Silver Miners ETF (NYSE:SIL). It gained 4.5% last week to reach a three-month high. Another move of that magnitude this week would put SIL at a new high for the year – and give silver itself some catching up to do!

About the Author:
Stefan Gleason is CEO of Money Metals Exchange, the company recently named "Best Overall Online Precious Metals Dealer" by Investopedia. A graduate of the University of Florida, Gleason is a seasoned business leader, investor, political strategist, and grassroots activist. Gleason has frequently appeared on national television networks such as CNN, FoxNews, and CNBC and in hundreds of publications such as the Wall Street Journal, TheStreet, and Seeking Alpha.
