
Gold continues to move higher due to trouble in the Fed Repo and U.S. Treasury Market. In the first hour of business today, the Fed has already injected $57 billion into the Repo Market. While the Fed’s Repo Market injections didn’t spike during the last few days of 2019, as many analysts forecasted, there’s still BIG TROUBLE ahead.
Many reasons have been attributed to the breakdown in the U.S. Repo Market that started on September 17th when the daily repo rate spiked to 10%. Several readers have sent me very interesting information and youtube videos on the subject matter. I thought it was a good time to sift through all the information and present my analysis of what the hell I believe is going on.
First and foremost, while there are many reasons given for why the Fed Repo rate spiked, forcing the Fed to provide hundreds of billions of dollars of short-term liquidity in the market, these are “ALL SUPERFICIAL” reasons. The major factors causing widespread havoc throughout the financial system are the Falling EROI- Energy Returned On Investment of oil and the Thermodynamics of oil depletion. While these are two different energy analyses, they come to the same conclusion. The financial analyst community and market are still ignoring these key energy factors.
Second, the main “SUPERFICIAL” reason that caused the Fed Repo rate to spike is that there weren’t enough buyers for the increasing amount of U.S. Treasury issuance.
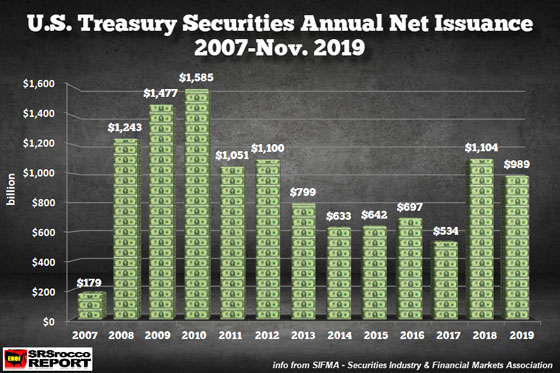
After the 2008-2009 financial crisis, U.S. Government deficits ballooned, forcing the “Net Issuance” of more U.S. Treasuries. In the chart above, the net issuance of U.S. Treasuries spiked to $1,585 billion ($1.58 trillion) in 2010. However, after the economy started to recover, the net issuance of U.S. Treasuries continued to decline to only $534 billion in 2017. But, the very next year, in 2018, something changed as the U.S. Treasury net issuance surged to $1,104 billion. This was bad news… but why?
We have to remember that the Fed started reducing its balance sheet by selling U.S. Treasuries and Mortgage-Backed Securities into the market in early 2018:
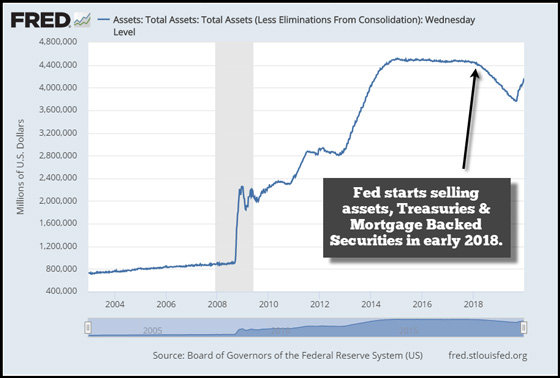
So, get this… the Fed was a net seller of U.S. Treasuries and Mortgage-Backed Securities in 2018 right at the very same time, the U.S. Government’s net issuance of U.S. Treasuries doubled from $534 billion in 2017 to $1,104 billion in 2018. This had a profound impact on the U.S. Treasury rates, especially the 10 Year/3 Month Spread.
Now, to make this easy to understand, the 10-Year/3 Month Treasury rate spread shows how much more demand there is for either the shorter-term Treasuries or the longer-dated ones. If the 10-Year/3 Month spread falls, then there is more demand for the 10-year Treasury, which suggests investors are worried about an upcoming recession. The 10-Year/3 Month U.S. Treasury spread has been steadily falling since 2010 and is now only 0.02 compared to 3.08 in 2010:
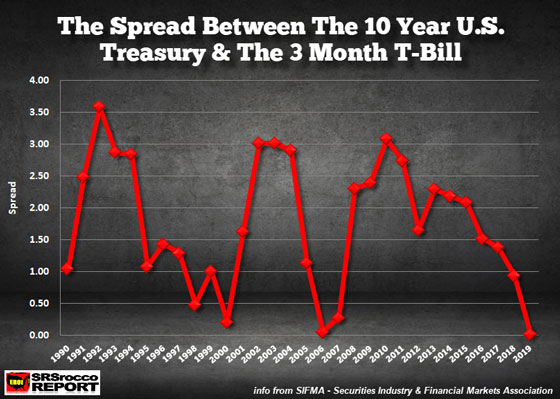
According to SIMFA, the Securities Industry & Financial Markets Association, the average rate for the 10 Year U.S. Treasury (Jan-Nov) was 2.17 versus 2.15 for the 3 Month Treasury Bill. Thus, there is a positive 0.02 Spread. However, there were some real problems starting in June when the 10-Year/3 Month Treasury spread went NEGATIVE:
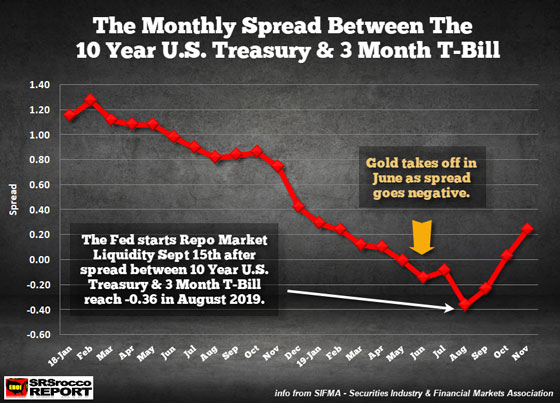
There is no coincidence that the Gold Price began to take off in June 2019 when the 10-Year/3 Month Treasury spread went negative… for the first time since the 2007 financial crisis began. As the 10-Year/3 Month, Treasury spread went further negative until August, the gold price continued higher to reach a peak of $1,560 at the end of the month. Then what happened in September and October?? You got it, the Fed came in and started the Repo Operations in mid-September and then announced the $60 billion a month in U.S. Treasury purchases in mid-October:
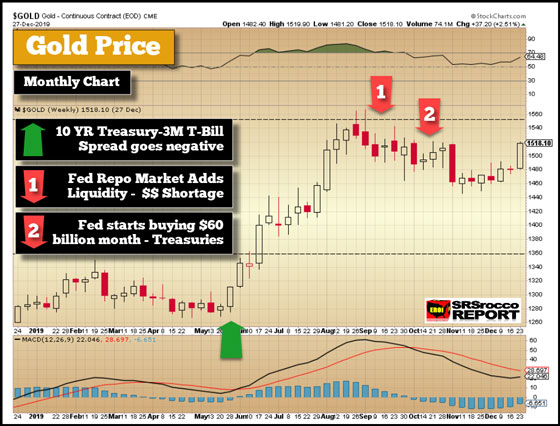
The GREEN arrow shows where the 10-Year/3 Month Treasury spread started to go negative, and over the next three months, as the spread reached a low of -0.36 in August, the gold price increased by $300. The RED arrows show that when the Fed came in to save the day in September with its Repo Market operations, providing short-term liquidity, and then again in October to buy $60 billion a month, the 10-Year/3 Month spread moved higher.
If we look at the U.S. Treasury Net Issuance chart again, we can see that the U.S. Government is in trouble as it has to finance a lot more of its annual deficits:
With the global economy stalling and some regions heading into a recession, there are fewer surpluses available to be able to buy the increasing amount of U.S. Treasuries, not including the amount that is continuously rolled over.
Even though there may be a BIG PROBLEMS with individual banks that caused the Fed Repo rate to spike on September 17th, the main issue is that the U.S. Government is issuing more Treasuries than the market can absorb. Thus, the Fed had to start buying U.S. Treasuries, which helped push the 10-Year/3 Month spread back into positive territory. However, the problem isn’t over as the market mistakenly assumes… IT’S JUST BEGINNING.
I believe the September 17th Fedo Repo rate spike to 10% was the CRISIS and will only get worse as time goes by.

About the Author:
Independent researcher Steve St. Angelo started to invest in precious metals in 2002. In 2008, he began researching areas of the gold and silver market that the majority of the precious metal analyst community has left unexplored. These areas include how energy and the falling EROI – Energy Returned On Invested – stand to impact the mining industry, precious metals, paper assets, and the overall economy.
