According to the recently released 2019 World Silver Survey, silver investment demand was significantly higher than analysts forecasted. How much higher? A lot, especially since the analysts stated that silver coin and bar purchases were expected to contract due to falling demand globally.
However, when the data was finally collected, it turned out that physical silver investment was the leading growth sector in the silver market in 2018… by a large degree. And, we can thank super-strong Indian silver demand for pushing physical investment to double-digit growth instead of a substantial decline.
Now, if we look at the information released by the Silver Institute back in November 2018 (Silver Interim Report), it stated that silver coin and bar demand was estimated to drop by 12% in 2018:
Bar and coin demand will be the main driver behind the fall contracting another 12.2% to 124.8 Moz in 2018. New physical coin demand has remained under pressure this year, particularly in the United States during the first half of the year, as investors relied on the secondary market with older dated coins for their investment needs. Physical bar and coin demand in other regions have also been disappointing this year, contracting mainly in the single digits as investors remained on the sidelines awaiting higher price volatility.
The folks at GFMS, who are now a part of the Refinitiv Company, forecasted last year that silver bar and coin demand would fall by 12%, followed by a 1.8% drop in Industrial demand and a 0.6% reduction in jewelry and silverware:
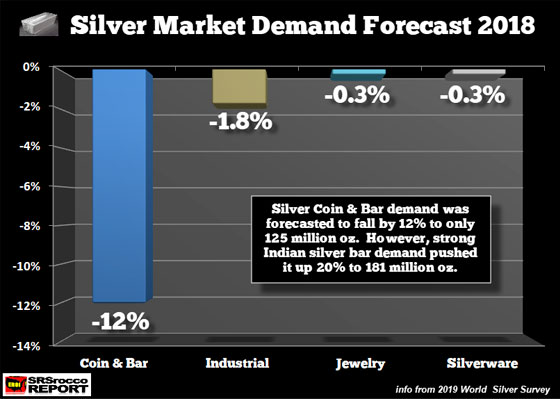
Thus, overall global silver demand was expected to decline by 3% in 2018, mainly due to the large drop in coin and bar purchases. However, when the report came out just a few days ago, silver coin and bar demand surged by 20%. Investors purchased a stunning 181.2 million oz (Moz) of coin and bar, 45% higher than the 124.8 Moz forecasted in November last year:
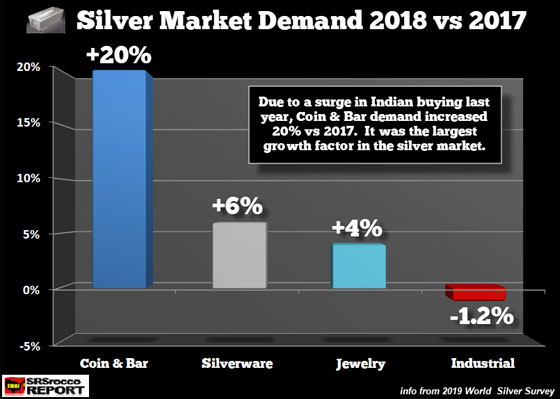
If we look at both charts, the GFMS analysts were spot on with Industrial silver demand. Industrial silver demand fell modestly in 2018 due to a decline in the PV Solar sector. According to the 2019 World Silver Survey, while Photovoltaic manufacture increased in 2018, actual silver consumption in PV solar cells and films fell by more than 8 Moz.
Also, even though the jewelry and silverware market demand increased last year, the real winner in the silver market was coin and bar. Again, Indian silver investment demand shot up “exponentially” by 115% last year (actually term used in the 2019 World Silver Survey). You see when the silver price falls, the West stops buying, but savvy Indian investors take advantage of the low price. What do they know that Westerns seem to be missing??
Anyhow, some readers might be saying, who cares about silver investment demand if the price continues to be low? Yes, this, of course, is extremely frustrating for precious metals investors. However, we must understand that mania is currently in the stock and bond markets. The overwhelming majority of investors are not paying attention to gold or silver. Well, maybe some gold, but not a lot of silver. But, they should.
As I have mentioned, I have been watching the trading in the Intra-day stock markets, and the insanity taking place daily… is off the charts. Blue chip stocks today are behaving like cryptos… something I thought I would never see.
Stocks Now Trading Like Cryptos
For example, Disney’s stock price surged by $16 in two days on the news that the company plans on providing cheaper streaming content to compete with Netflix. When Disney’s stock price closed last Thursday, it was trading at $116.50. The next day when the market opened, Disney was trading at $128 and then continued higher to $131. By the next day, Disney surpassed $132.50. Thus, the mere announcement by Disney that they would be competing with Netflix motivated investors to push the stock up 14%… similar to how the cryptos trade.
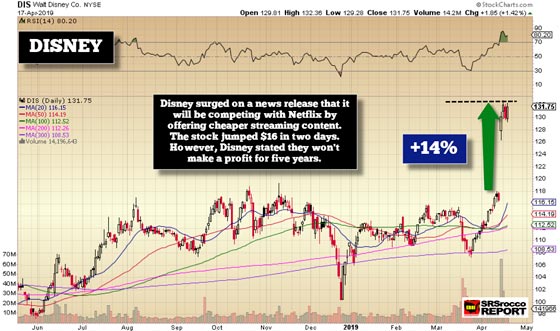
Interestingly, investors must have overlooked the fact that Disney announced that they don’t plan to make a profit for five years with their new streaming content business. Of course, profits don’t seem to matter anymore to investors, especially in the U.S. shale oil industry.
Regardless, the large stock GAP UPS and crazy moves that I see in the stock market today are completely insane. If we look at Disney’s chart over the longer term, the lunacy of these market moves becomes more apparent.
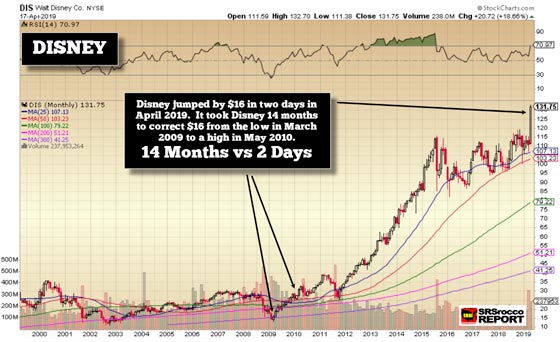
While Disney’s stock price skyrocketed by $16 over the past two days, it took the company 14 months to experience the same movement from its low in March 2009 to its high in May 2010. Yes, it’s NEAT that Disney will be competing with Netflix, but is that a good idea in the first place? I mean… come on. Netflix still isn’t making money if we look at its free cash flow. Netflix’s total free cash flow was a negative $7.2 billion over the past four years… with -$2.8 billion for 2018 alone.
Yeah… I get it. Investors believe that Netflix and Disney will become extremely profitable in the future. But who on hell bids up stock to such high levels with the promise of profits five years from now? We have gone Bollocks completely.
And if you think Disney’s price move is something… take a look at what happened to QCOM. The company announced a favorable settlement with Apple on Tuesday at 3 pm, and the stock price soared by more than $24 in less than two days. QCOM surged from $58 on Tuesday to $82 Wednesday.
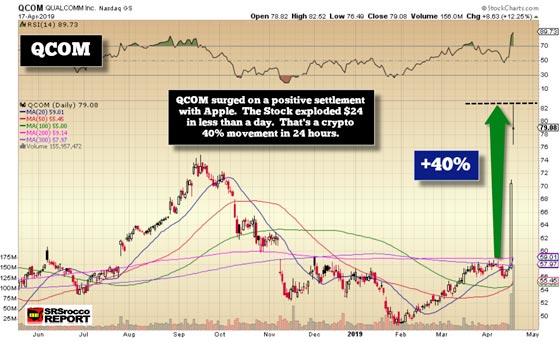
QCOM’s stock price surged by 40% in less than two days. This makes the trading in Bitcoin and the cryptos look quite tame indeed. What is taking place in QCOM is eerily similar to how the stock performed during 1999’s Tech Boom and Bubble. QCOM’s stock price increased from $10 in June 1999 to over $70 in January 2000.
After the Tech Boom Crash in 2000, QCOM fell back down to $10 in 2002. My forecast for QCOM after the next market meltdown is to fall to at least $25, its long-term resistance level.
So, what does this all mean? Well, it means that investors are currently playing the GRAND STOCK MARKET CASINO and the trillions of chips are flying across the table. No one seems to care about precious metals right now because there are so much excitement and euphoria in the markets. Why wouldn’t anyone want to miss out on the chance to see their stock price move up 10-30% in a few days?
Gosh, when was the last time gold went up 5% in a day… LOL. If we base the gold price on $1,200, a 5% move would be $60. I can’t remember the last time gold went up 5%, much less 14% like Disney or 40% like QCOM. These stocks are now behaving like cryptos, and that is not a good sign.
Lastly, while it has been frustrating for precious metals investors lately, it will be nothing compared to the gut-wrenching market collapse in the broader markets when the fundamentals finally kick in… and they will.

About the Author:
Independent researcher Steve St. Angelo started to invest in precious metals in 2002. In 2008, he began researching areas of the gold and silver market that the majority of the precious metal analyst community has left unexplored. These areas include how energy and the falling EROI – Energy Returned On Invested – stand to impact the mining industry, precious metals, paper assets, and the overall economy.


