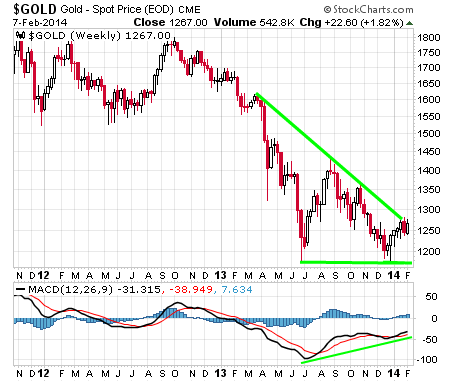
After rallying last week, both gold and silver now have a shot at breaking out above important resistance levels and turning their intermediate-term trends positive.
Precious metals prices rose last week despite a 400-point mid-week reversal to the upside in the Dow Jones Industrials. During recent months, precious metals – especially gold – have tended to move in the opposite direction of stocks. But the equity strength last week didn't come at the expense of gold and silver, and THAT is an encouraging sign for precious metals bulls.
Positive Momentum Building
Also encouraging is the price action in gold so far this year. The yellow metal is up 6% year to date. More importantly, gold prices are on the verge of breaking above a down-sloping trend that has been in place for several months.

A rally that drives gold prices near $1,300 would signal the termination of the downtrend, setting the stage for a run to at least $1,400 in the coming weeks.
Meanwhile, the weekly Moving Average Convergence/Divergence (MACD) indicator shows a bullish crossover took place in January, with a positive divergence from last June's low. A rising MACD suggests the likelihood of an upside breakout in prices – and one with some pent-up momentum behind it.
Another positive weekly close for gold spot prices this week would confirm in many traders' eyes that a major breakout is in progress.
Track Growth in Government Debt
The U.S. government exhausted its statutory debt limit of $17.2 trillion on Friday. The Treasury Department is now taking what it calls “extraordinary measures” to pay all its bills.
Of course, these “extraordinary measures” have by now become routine, and financial markets barely paid attention to the Obama Administration's attempt to make a crisis out of Congress's failure so far to raise the debt ceiling.
The debt ceiling will get raised, as it always does before any government programs are put at risk of being cut to avoid the need for more borrowing. Over the long term, gold prices track increases in the debt ceiling – though not necessarily in any given year. The gold price got way ahead of the trajectory of national debt growth by 1980 but then fell way behind by 2000.
Since 2000, gold prices have made up some ground versus accelerating debt growth, but gold hasn't yet come anywhere near the overextended levels of 1980.
Consider that in 1980, gold got as high as $850/oz with a national debt of $900 billion. Today's national debt (which doesn't even account for unfunded liabilities or the massive expansion of the Fed's balance sheet) comes in at $17,200 billion ($17.2 trillion) – an 18-fold increase since 1980!
Potential Market-Moving News This Week
Investors will be eyeing the budget battle in Washington and scrutinizing the testimony of new Federal Reserve chair Janet Yellen as she makes her first official appearance before the House Financial Services Committee. On the economic data front, it will be a light week of reporting:
- Thursday, Feb. 13th - Retail Sales.
- Tuesday, Feb. 11th and Thursday, Feb. 13th - Janet Yellen's Testimony before Congress. Markets may react to any comments from Yellen that hint at whether the Fed will halt tapering or continue inching back its stimulus measures.

About the Author:
Clint Siegner is a Director at Money Metals Exchange, a precious metals dealer recently named "Best in the USA" by an independent global ratings group. A graduate of Linfield College in Oregon, Siegner puts his experience in business management along with his passion for personal liberty, limited government, and honest money into the development of Money Metals' brand and reach. This includes writing extensively on the bullion markets and their intersection with policy and world affairs.


