The U.S. Government is in serious trouble when interest rates rise. As interest rates rise, so will the amount of money the U.S. Government will have to pay out to service its rapidly rising debt. Unfortunately, interest rates don’t have to increase all that much for the government’s interest expense to double.
According to the TreasuryDirect.gov website, which came back online after being down for nearly a month, reported that the average interest rate paid on U.S. Treasury Securities increased from 2.2% in November 2016 to 2.3% in December 2017. While this does not seem like a significant change, for every increase of 0.1% in the average interest rate, the U.S. Government has to pay an additional $20.5 billion in interest expense (based on the $20.5 trillion in total U.S. debt).
Already, the U.S. Government is off to a BANG as its interest expense paid for the first three months of the year increased to $147 billion compared to $139 billion in the same period last year:
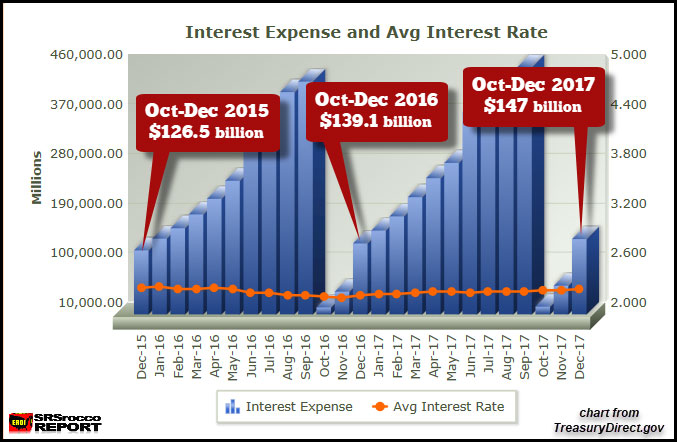
This chart was taken directly from the TreasuryDirect.gov site, with my added annotations. As we can see, the U.S. Government paid $126.5 billion to service its debt Oct-Dec 2015. We must remember, the U.S. Government Fiscal period starts in October. So, in just two years, the interest expense the U.S. Government paid for Oct-Dec increased by more than $20 billion. Now, what is interesting is that the average interest rate in Dec 2015 was 2.33%, but in Dec 2017 it was only 2.31%. Thus, it was lower, even though the interest expense increased by $20 billion.
The reason for the $20 billion increase in the interest expense during Oct-Dec 2017 versus Oct-Dec 2015 was due to a more than $2 trillion increase in U.S. debt over those two years. So, the U.S. Government will have a serious problem as interest rates start to rise… and that doesn’t even include the continued increase in total U.S. debt.
This next chart shows the increase in U.S. debt, while the average interest rate fell from an average of 6.6% in 2000 to a low of 2.2% in 2016:
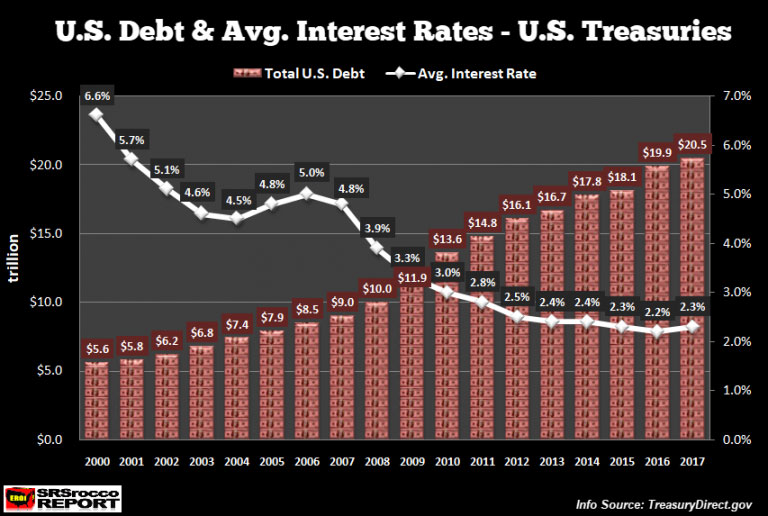
The falling average interest rates occurred due to the Federal Reserve policy to stimulate the economy as well as to keep the U.S. Government interest expense from skyrocketing.
Now, there is a difference between the U.S. Federal Government net interest expense of $266 billion on the $14.7 billion in public debt in 2017 versus the total $458 billion interest expense on total debt of $20.3 trillion, which includes “intragovernmental holdings.” The Federal Government is only stating the interest it’s paying on the public debt in its budget. However, Intragovernmental debt is debt that one part of the government owes to another part. In almost all cases, it is debt held in government trust funds, such as the Social Security trust funds.
So, if we want to know the total interest expense paid via total U.S. Treasury Securities, we have to also include the intragovernmental holdings or the amount that the U.S. Government has borrowed from other governmental agencies.
For example, before the government raised the debt ceiling on Sept 7th, the public debt was $14,410 billion, and the intragovernmental holdings were $5,434 billion for a total of $19.844 billion:
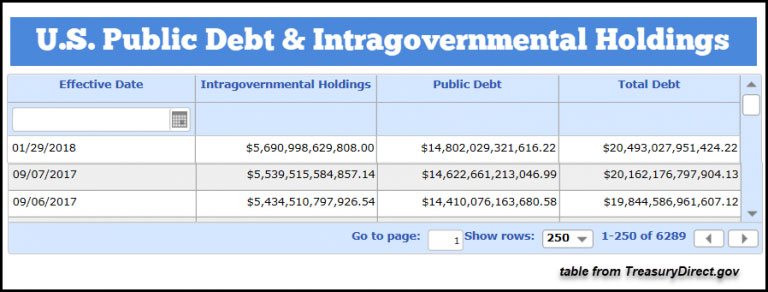
However, the intragovernmental holdings increased the most in percentage terms by rising 4.7% ($256 billion) to $5,690 billion while total public debt only increased 3.2% ($649 billion) to $14,802 billion… for a total of $20,493 billion. The U.S. government still has to pay interest on its intragovernmental holdings… and a lot of that interest is going to pay for Social Security. According to Social Security Report in July 2017, of the $836 billion in benefits paid in 2017, an additional $88 billion came from earned interest. Thus, 10% of Social Security payouts last year came from a large percentage of interest earned on the Social Security portion of the intragovernmental holdings.
If we consider total U.S. Government interest expense, including intragovernmental holdings, it hit a record high of $458 billion in 2017:
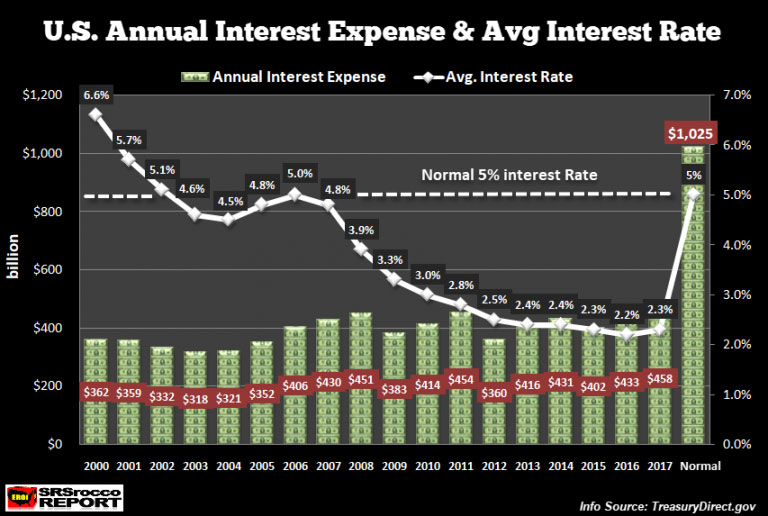
Unfortunately, when interest rates move back toward a more normal rate of 5%, the U.S. Government will have to fork out $1 trillion-plus a year, just to service its total debt. Even though the Federal Reserve might try to lower interest rates during the next market crash, the market will likely react in the opposite direction as real rates start to rise.
The Central Banks have purchased $15 trillion in assets since the 2008 market meltdown. Furthermore, their zero-interest rate policy has driven speculative growth with the addition of $70 trillion in debt in the same period. While the Central Bank's insane easy monetary policy may continue for a few more years, the tremendous amount of LEVERAGE in the system is getting out of hand.

About the Author:
Independent researcher Steve St. Angelo started to invest in precious metals in 2002. In 2008, he began researching areas of the gold and silver market that the majority of the precious metal analyst community has left unexplored. These areas include how energy and the falling EROI – Energy Returned On Invested – stand to impact the mining industry, precious metals, paper assets, and the overall economy.
