Even though the gold price increased in 2018, the top gold miners' production declined while costs continue to escalate. Output at three of the top gold miners in the world fell in the first half of 2018 compared to the same period last year. With rising costs due to higher energy prices, on top of decreasing production, the top gold miners' free cash flow declined precipitously in 2018.
While many analysts focus on the company’s profits or net income, I like to pay attention to its free cash flow. Free cash flow is nothing more than subtracting capital expenditures from the company’s cash from operations. Because the gold mining industry is very capital intensive, the company’s free cash flow is a better indicator of financial health rather than the net income.
As mentioned, all of the top three gold miners suffered production declines in the first half (1H) of 2018 versus the same period last year. The biggest loser was Barrick, whose production declined over 20% by falling to 2.1 million oz in 1H 2018 compared to 2.7 Moz in the previous year. Goldcorp’s production fell 10%, while Newmont’s output dropped by nearly 9%:
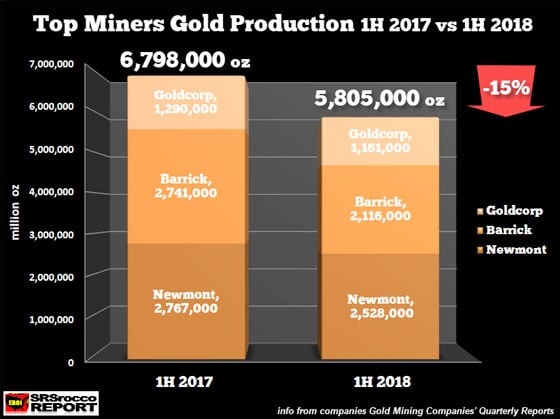
Altogether, the top three gold mining companies’ production fell 15% or approximately 1 Moz in the first six months of 2018 versus last year. Even though Goldcorp isn’t the third largest gold miner in the world, the company has already posted its second-quarter results. AngloGold is the third largest gold miner, but it won’t publish its financial statements until August 20th. Also, Kinross is likely ranked number four ahead of Goldcorp, but the company posts its production figures in “gold equivalent ounces.” If a company has to publish its gold or silver production in “equivalent ounces,” then the analysis is a bit flawed in my opinion.
Regardless, these top three gold miners all experienced declines in production which impacted their financial balance sheets. To get a better idea of the true cost of production and the health of the gold mining industry, I have come up with an “Adjusted Earnings Breakeven” price as well as a “Free Cash Flow” breakeven price.
The gold mining industry publishes “Cash Costs” and “All-In Sustaining Costs (AISC),” but those metrics deduct by-product metal revenues and don’t include ALL COSTS. For instance, Goldcorp publishes a much lower All-In Sustaining Cost of $850 an ounce because it subtracts its by-product credits from its cost analysis. Of the $1,639 million of total revenues 1H 2018, Goldcorp sold $431 million in silver, zinc, and misc metals. By deducting $431 million, or 26% of total revenues, from its cost of sales, the company can post a low $850 per oz AISC.
But, what if Goldcorp removed that $431 million in by-product metal revenues from its financials? How would that impact its net income?? Goldcorp suffered a $64 million net income loss in 1H 2018. If we take away the $431 million in by-product revenues, Goldcorp would have lost nearly $500 million, not the $64 million. Goldcorp needed that $431 million in by-product metal revenue to fortify its balance sheet.
So, this is the sort of accounting gimmicks that the mining industry pulls on less sophisticated investors…. which are many.
Again, I don’t pay much attention to the Cash Costs, or All-In Sustaining Costs as they do not provide an accurate picture of what is taking place in the gold or silver mining industry.
To get a better understanding of the financial health of the gold mining industry, we need to look at the companies' free cash flow. In the first half of 2017, these top three gold miners enjoyed a combined positive free cash flow of $718 million, with the majority coming from Newmont:
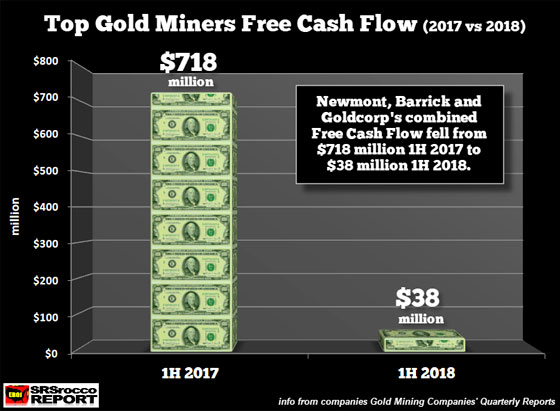
Of the total $718 million in positive free cash flow, Newmont accounted for $530 million, Barrick provided $204 million, and Goldcorp posted a negative $16 million. However, free cash flow in all three decreased significantly in 1H 2018 to only $38 million. Newmont’s free cash flow fell to $173 million, Barrick declined to $9 million and Goldcorp’s dropped even further to a negative $144 million.
Also, my estimated “Adjusted Earnings Breakeven” for the group increased in 2018. If we compare my two financial metrics (adjusted income breakeven & Free Cash Flow Breakeven) to the average gold price during each period, we have the following:
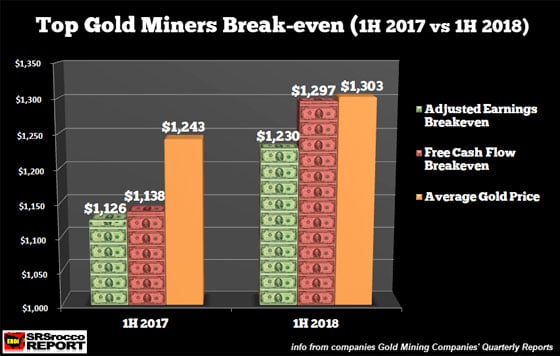
As we can see in the chart above, these top three gold miners' profit margins were much higher during the first half of 2017, even with a lower gold price. My estimated Adjusted Earnings Breakeven for the group was $1,126 per oz based on an average gold price of $1,243. Thus, the group’s gold profit margin was nearly 10% last year. However, the Adjusted Earnings Breakeven increased to $1,230 for the group in 1H 2018. Thus, the profit margin of the group fell to 5.6%.
Also, the Free Cash Flow Break-Even per ounce increased to $1,297 versus $1,138 last year. Because these top three gold miners combined free cash flow was only $38 million 1H 2018, they only made a few dollars per ounce of free cash flow. Unfortunately, free cash flow does not include dividend payouts. These three gold miners paid a combined $242 million in dividends to shareholders. While Newmont can afford to pay its $150 million in dividends, Barrick and Goldcorp did not have enough positive free cash flow to pay their dividends.
Furthermore, if you watched my newest video below, you would have found out the pathetically small amount of cumulative free cash flow the top four gold miners reported over the past twenty years. If we take that amount and divide it by their total production, the positive free cash flow was a miserable $19 per ounce:
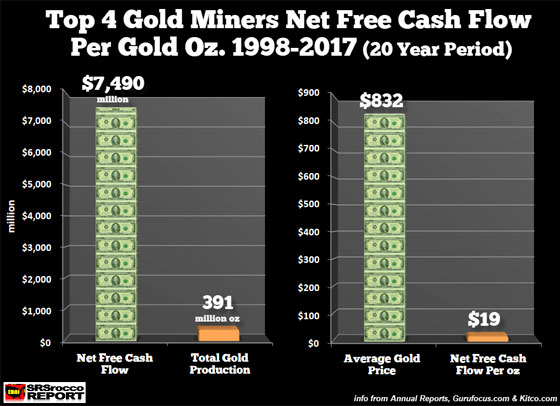
Barrick, Newmont, AngloGold, and Barrick only posted a net $7.5 billion in positive free cash flow from 1998-2017. If we divide the 391 Moz of total gold production, the net free cash flow per ounce was $19. Now compare that to the $832 average gold price during the twenty years.
By focusing on the Free Cash Flow, over an extended period, we can see that the top gold mining companies haven’t made all that much money. Also, I haven’t included share dilution or the increase in debt. I will cover these in another article.
If you haven’t watched my newest video about the Gold Mining Industry, I highly recommend it:
Lastly, while I provide data that suggests the gold mining industry cost of production is higher than the market reports or that the combined free cash flow has been quite small, I still believe the gold miners will be one of the few assets to own when the entire markets crash over the next several years.

About the Author:
Independent researcher Steve St. Angelo started to invest in precious metals in 2002. In 2008, he began researching areas of the gold and silver market that the majority of the precious metal analyst community has left unexplored. These areas include how energy and the falling EROI – Energy Returned On Invested – stand to impact the mining industry, precious metals, paper assets, and the overall economy.
