
While many investors believe the gold and silver price will crash during the next market meltdown, I see a much different outcome. Yes, it is true that the metals may sell off initially in the beginning, but I believe gold and silver will disconnect from the broader markets and move up much higher.
The reason I see the precious metals disconnecting from the broader markets during the next major correction is due to the much different setup today in the gold and silver market than it was in 2008. Precious metals investors forget just how overvalued the gold and silver prices were based on technical analysis. Of course, I am not talking about the true “Store of value” properties of the precious metals, but rather, how they trade about the market in general.
As I have stated many times, the paper trading market determines the price of gold and silver, not the physical buyer. Thus, the paper market will continue to control the gold and silver prices until investors realize the dollar is just another worthless fiat currency.
In my newest video, How Will Gold & Silver Trade During The Next Market Crash, I use a few indicators to explain why I don’t see a huge crash in the gold and silver prices during the next major market correction:
In the video, I discuss how the broader markets are setting up for a significant correction lower while the precious metals are behaving more like a coiled spring. Although, in the initial stages of market meltdown, we could see a broad-based selloff across all markets. However, the technical analysis suggests that the gold and silver prices are much closer to a bottom than a top.
Furthermore, another indicator, the Gold Hedgers Chart also provides more evidence that gold is become oversold, rather than overbought:
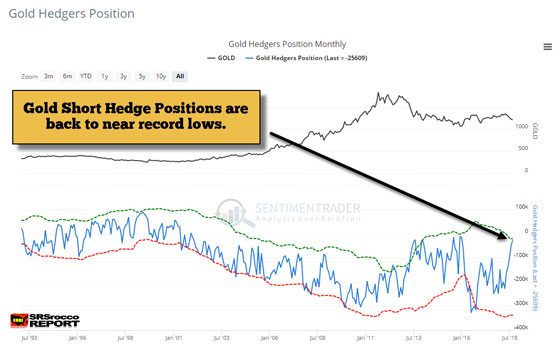
The gold short hedge position is now back to almost the same level as it was at the beginning of 2016 when gold was trading below $1,100 an ounce. This chart shows that when the gold hedgers position moves back towards the zero line, then the gold price is forming a bottom.
Lastly, when the Dow Jones Index fell 2,000 points at the beginning of 2016, investors flocked into gold and silver. As gold shot up in the first quarter of 2016, flows in the Gold ETF’s were the second highest in history. The quarter with the most Gold ETF inflows was Q1 2009 when the market was crashing to its lows. So, what do you think will happen when the Dow Jones falls precipitously this time around??
If you want to receive my newest videos, please consider subscribing to my: SRSrocco Youtube Channel.

About the Author:
Independent researcher Steve St. Angelo started to invest in precious metals in 2002. In 2008, he began researching areas of the gold and silver market that the majority of the precious metal analyst community has left unexplored. These areas include how energy and the falling EROI – Energy Returned On Invested – stand to impact the mining industry, precious metals, paper assets, and the overall economy.
