After taking ten weeks for palladium to rise from $1,300 to $1,550, it only took three days to fall to $205. The majority of the decline occurred over the past two days. Now, some may say that the huge crash in the palladium price smells of market manipulation. However, I don’t buy that. Rather, I believe it’s nothing more than “Momentum Trading Gone Wild.”
Of course, people are still going to believe that the banks had something to do with it, but it takes TWO TO TANGO. We have to remember; there has to be someone buying up palladium to push its price to new highs.
As I have mentioned, I have been watching day trading, and it amazes me how fast and high some of these stock prices reach in a very short period. And the reason given is some positive news or better-performing financials, guidance, or whatever. While that might be the motivation to get the ball rolling, there is a wild pack of traders ready and waiting to jump on a new trend. And as the trend moves up higher, more traders jump aboard providing what I call, “Momentum Trading Gone Wild.”
Gosh, this happens day in and day out. Before I provide some charts on Palladium, let me share with you a company called MongoDB, Inc. It trades under the stock ticker, MDB. This stock came on my radar as its price started shooting straight up. MongoDB is one of those technology companies that is supposed, “the leading modern, general purpose database platform.”
When its positive financial results came out, MDB’s revenues jumped by 72%, from $154 million in 2017 to $267 million last year (the company’s year takes place at the end of January). However, while the revenue increase was excellent, the company still lost gobs of money. While MBD racked up more revenues, unfortunately, it also suffered a net income loss of $98 million. For some odd reason, traders and investors focus on the increased revenue but they tend to ignore the company has lost money for the past five years.
Yes, they say that in time, they will become profitable, but come on… is a company that is losing nearly $100 million worth $155 a share??
Let’s take a look at MBD’s daily chart:
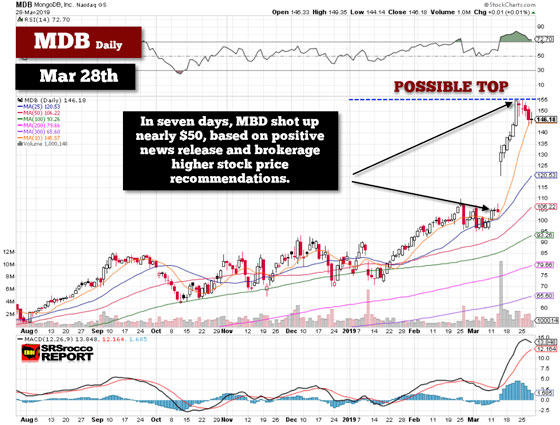
MDB’s stock gapped up from $106 to $155 in just seven trading days. Thus, it took one hell of a bunch of motivated “Traders Gone Wild” to push the stock to a record high. Of course, some buyers could have been funds looking to add another HIGH TECH WINNER to their portfolio, but a lot of the price momentum was also due to traders.
And to help get MDB up to that lofty $155 level, in come the Brokerage Recommendations:

You will notice the day MBD’s stock price gapped up and traded by more than $30, was on March 14th, the day the three new BUY recommendations came out. So, with the word out by the WISE BROKERS, the sheep traders and funds stepped in and pushed MDB’s price up to new highs.
Let me tell you, I have looked at this company and maybe it provides some top-notch software service, but you don’t push a stock price up $50 on the PROMISE OF PROFITS in the future. This is what the market has become.
… Momentum Trading Gone Wild.
So, if you think this is only taking place in stocks, think again.
PALLADIUM’S WILD RIDE: Trading Momentum Gone Wild
Ironically, I watched a Kitco interview on Tuesday here: Palladium and Rhodium Have More Headroom Left – Peter Hug, right before the price crashed $205. Peter Hug goes on to say that Palladium has more room to run, but investors should realize there are $50-$70 corrections. I can assure you; Peter Hug had no idea that palladium would fall $205 in three days.
Now, I am not blaming Peter as I was stupid enough to make price predictions some years ago… no longer. However, I have been warned that palladium was getting overheated for a while. Sure, the price did continue higher like the lousy MDB stock shown above, but at some point, investors stop buying.
First, let’s take a look at palladium’s daily stock price:
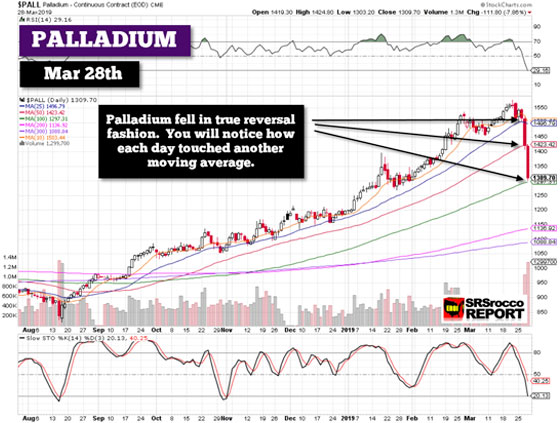
On Thursday, March 21st, not one person in the world would pay any more than $1,576.90 for palladium. That was the day palladium peaked. Unfortunately, that poor slob who purchased palladium at that price had no idea that he or she was the last BULL in the world… for that price trend. While palladium corrected up and down over the next three days, the real carnage took place on Wednesday and Thursday when the price fell more than $200.
Secondly, if you look at those two daily price declines, they both traded right at the moving averages… no coincidence.
The next chart is palladium’s weekly chart. We can see the crash more readily in this chart:
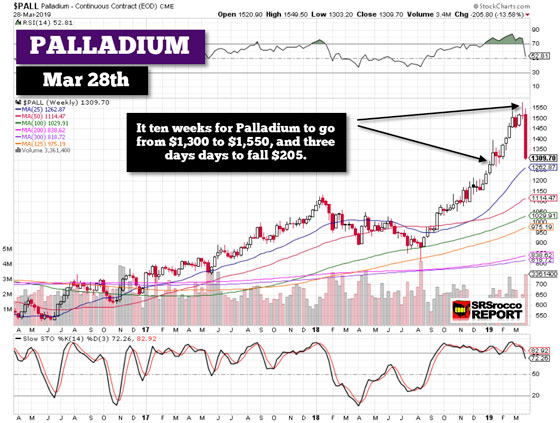
As I mentioned at the beginning of the article, it took palladium ten weeks to go from $1,300 to $1550 (closing prices) and only three days (really two) to fall $205.
Now, I would imagine some of you believe palladium’s massive price movement from the low $800s in August to $1,550 in March was due to the fundamental shortages and ongoing annual deficits. Well, that might be partly true, but palladium has been experiencing deficits since 2012:
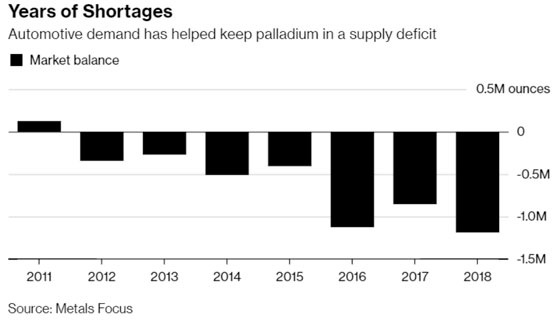
Furthermore, one of the most significant deficits took place in 2016, but the palladium price only increased by $100 that year (starting at $560 and ending at $660). That doesn’t seem like much of a price increase for such a large annual deficit. Yes, it’s true that the annual deficits have been higher the past three years, but do investors realize as of the end of 2017 (best data I could find), there was still something like 9.6 million oz of palladium above-ground stocks?? That data came from the GFMS World Platinum Group Survey 2018, page 25.
Moreover, 25% of the annual palladium supply in 2017 came from autocatalyst recycling. That’s correct; they are recycling a great deal of palladium, nearly 2.2 million oz in 2017 (source GFMS). According to GFMS, autocatalyst recycling of palladium has increased from 1.1 million oz in 2009 to a forecasted 2.7 million oz in 2018.
While palladium has been experiencing large annual deficits, the huge price movement only took place over the past eight months. My analysis suggests that the “Palladium Price Spike Pot” had been stewing for a few years and it finally took off in August last year. As more and more traders joined the Palladium bandwagon, the higher the price went. Thus, we reached the point when “Momentum Trading Gone Wild.”
So, I wasn’t surprised to see palladium fall that much in just a few days. I have seen this sort of price action in many stocks. Of course, I wouldn’t be surprised if Banks or Brokerage Houses were putting out higher price targets for palladium while taking the other side as a short. This is the way the market works. It puts out the BUY RECOMMENDATION, and the SHEEP comes for the slaughter.
Lastly, I would imagine the palladium price will need to correct back higher after such a large selloff, but I wouldn’t be surprised to see lower prices in the future, especially if the global economy continues to weaken over the next few years.

About the Author:
Independent researcher Steve St. Angelo started to invest in precious metals in 2002. In 2008, he began researching areas of the gold and silver market that the majority of the precious metal analyst community has left unexplored. These areas include how energy and the falling EROI – Energy Returned On Invested – stand to impact the mining industry, precious metals, paper assets, and the overall economy.


