
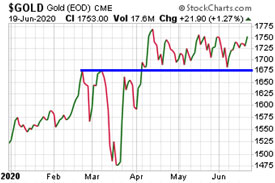
Gold prices have been trading within a well-defined $100 range over the past two months. Gold’s chart shows strong support at $1,675/oz and a zone of resistance at $1,750-$1,775.
A breakout above the trading range could quickly send gold prices to $1,900/oz – where they would challenge their former all-time highs set in 2011.
Seasonally, the month of June tends to be weak.
It wouldn’t be surprising if short sellers in the futures market managed to drive prices back down toward the bottom of the range one more time.
That said, gold prices are closer to breaking out than breaking down from this high-level consolidation. And given that this year has been extraordinarily atypical for all markets, we wouldn’t necessarily expect typical summer doldrums to afflict precious metals.
Silver has support at $17.00/oz and overhead resistance at $19.00. Silver prices ran up to the $19.00 level in late February (just before the crash) and did so again at the end of May.
A breakout above $19.00 and then above $20.00 would finally put silver on the map of mainstream investors – especially since it would likely coincide with record-high gold prices.
With silver being more affordable to retail buyers of limited means and more vulnerable to supply shortfalls, we expect it will outperform gold during the coming public participation upleg.

About the Author:
Stefan Gleason is CEO of Money Metals Exchange, the company recently named "Best Overall Online Precious Metals Dealer" by Investopedia. A graduate of the University of Florida, Gleason is a seasoned business leader, investor, political strategist, and grassroots activist. Gleason has frequently appeared on national television networks such as CNN, FoxNews, and CNBC and in hundreds of publications such as the Wall Street Journal, TheStreet, and Seeking Alpha.
