We've been surrounded by catalysts for years now, and while the price is up roughly 30% since January 2020, we all expected it to be at much higher levels by now based on a plethora of catalysts.
Maybe seasonality will play a role...
Gold and Silver's Best Time of the Year
As most readers know, gold became legal to own in the U.S. again in 1975.
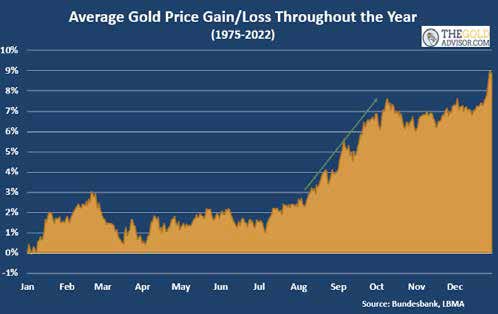
So, I averaged the daily gain/loss from that year through 2022. Here's what it shows over the 48-year period.
Gold Over a 48-Year Period
Silver Over a 48-Year Period
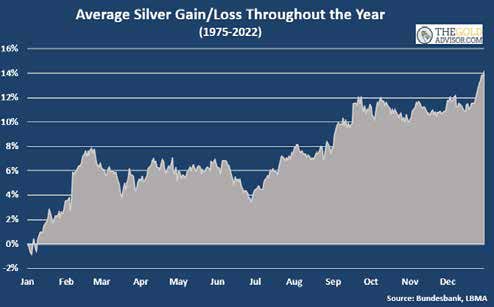
Silver's performance in September is better than gold's. Its biggest gains, however, start from the last day of June to the September high, averaging over 8%. And like gold, it finishes the year with a pop.
As the green arrow shows, on average the gold price sees its greatest gains from late August through early October.
The typical gain is 5.5% – you may not think that's much, but from its September 1 price it would take gold to its all-time again. The average gain from the July 4th holiday is 6.5%. And you can see it usually ends the year with a spike.
What About Recent Averages?
Some think the above charts don't paint the most accurate picture of seasonal strength since it includes the giant advances from the 1970s. It is true that both gold and silver had two huge runs in the 1970s, though I'll point out the advance in the first half of the decade is excluded in the above charts.
Let's zero in on a more recent timeframe, what gold and silver have done in the new century.
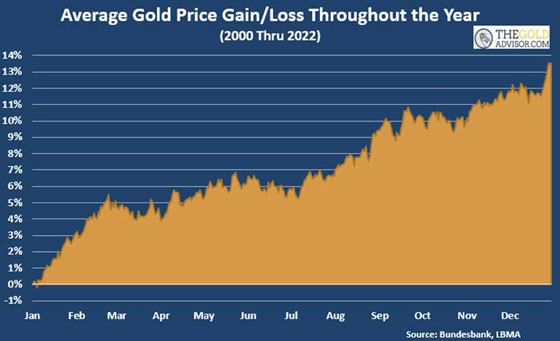
Here is the average daily gain/loss for gold from 2000 through 2022, a 23-year period that would be considered statistically significant.
Gold still has a good September, though the run tends to kick in just after the July 4th holiday. It typically cools in October, but again has the spike at the very end of the year.
And here's how the silver price has performed on average since 2000.
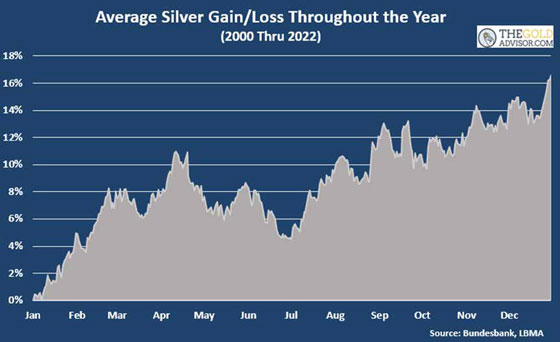
The price is more volatile, typical for silver, but you can see that the best part of the year is the second half. Including a pop at the end.
There's a message here for silver investors: don't get shaken out by the volatility!
I wouldn't use periods shorter than this to calculate seasonality. Short time frames can be subject to short term forces. They can also introduce recency bias. Last, as many have said, the further you look in the past the further you can see in the future.
Is a Bull Run About To Get Underway?
September tends to be a good month for gold and silver since it marks the end of summer and analysts and investors are back at their desks. They weren't buying gold with their phones at the beach.
I don't know about you, but my court was dead most of July and August, half my neighbors on vacation. My Twitter feed has seen fewer reactions, and views on our website were below average. Many company CEOs take their vacation in the summer, too.
With the summer doldrums over, investors presumably back at their desk, will gold and silver wake up?
Seasonal averages play out about twothirds of the time. Meaning one-third of the time they don't. But if seasonal trends persist this fall, gold and silver will end the year higher than where they traded this summer.
The gold price ended the month of August at $1,942.40. Will a fundamental catalyst break out and begin to boil the gold and silver pot? Will purchases in India push demand markedly higher like they typically do in the fall? Is a recession about to strike or the stock market ready to cool or crash, both of which are good for gold? Is a black swan circling?
Amidst all these questions is one more:
- Could normal seasonal strength kickstart the next gold bull run?
It doesn't happen every year, but it's occurred many times before.
Either way, as our French friends may say, être prêt (be prepared).
This article was originally published in The Prospector News.

About the Author:


