While silver is completely off the radar to most investors, it will turn out to be one of the best investments to own as the massive amount of leverage in the stock and real estate market evaporates. Unfortunately, investors, today are no longer capable of recognizing when an asset displays a HIGH or LOW risk. Thus, fundamental indicators are ignored as the investors continue the insane strategy of “Buying the Dip.”
A prudent investor can spot when an asset becomes a high risk and then has the sense to move his or her funds into one that is a lower risk. However, the majority of investors do not follow this practice as they are caught by surprise when a Market Crash occurs… again and again and again. Even worse, when investors are shown that the indicators are pointing to assets that are extremely risky, they ignore it and continue business as usual.
Today, complacency has turned investors’ brains into mush. They are no longer able to discern RIGHT from WRONG. So, when the market starts to correction-crash, they will hold on to their stocks waiting for Wall Street’s next BUY THE DIP call.
Regardless, if we can understand the fundamentals, then we would be foolish to keep most of our investment funds in Stock and Real Estate assets. The following chart follows the KISS Principle – Keep It Simple Stupid:
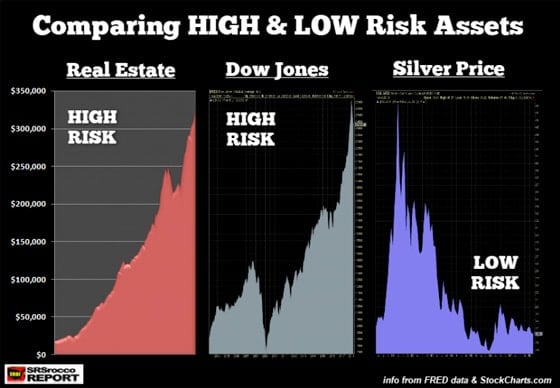
You don’t need to be a highly-trained financial or technical analyst to spot the HIGH vs. LOW-RISK assets in the chart above. Hell, you don’t even need to see the figures in the chart. If we understand that all markets behave in cycles, then it’s common sense that asset prices will peak and decline. We can see that both Real Estate and Stocks asset values are near their top while the silver price is closer to its bottom.
Thus, assets that are near the top are at HIGH RISK, and those near the bottom are at LOW RISK. It’s really that simple.
Now, if we look at each chart separately, we can easily spot which assets will be the BIG LOSERS in the future. According to the St. Louis Federal Reserve data (FRED), the U.S. Median Home Sales Price of $324,550 is nearly $100,000 higher than the bubble in 2007:
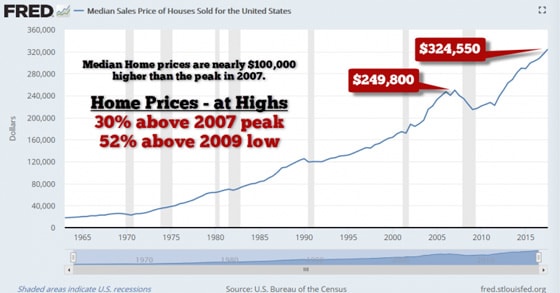
So, the current U.S. Median Home Sales Price is 30% higher than its previous peak in 2007 and 52% above its low in 2009. If I was going to invest in real estate, the best time to do so is at the bottom (LOW RISK), then at the top (HIGH RISK). However, Americans are piling into new and existing homes because they believe the prices will continue higher forever. Unfortunately for American homeowners and buyers, the Fed’s current policy to increase interest rates over the next year is not positive for the real estate market.
While U.S. Median home prices are 52% higher than their low in 2009, the Dow Jones Index is a staggering 220% higher during the same period. If U.S. real estate values are HIGH RISK, then the Dow Jones Index must be EXTREMELY RISKY:
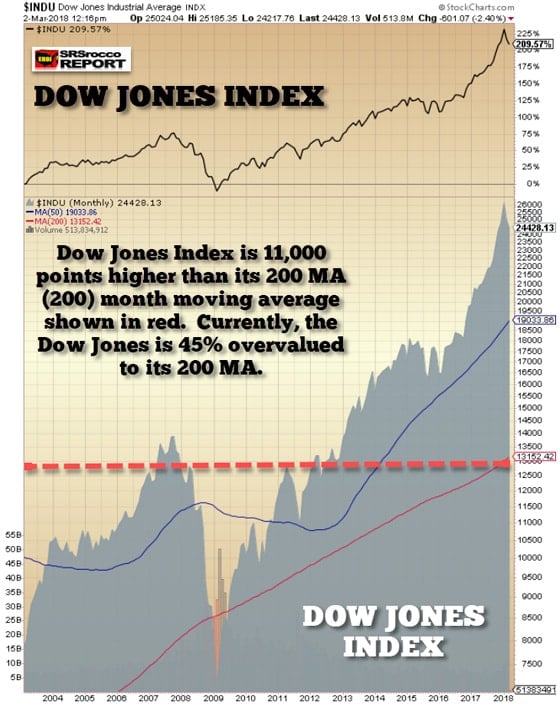
Going by the 200 Month Moving Average (MA), shown in red, the Dow Jones Index is 11,000 points higher, or 45% over-valued. However, if we went by the Dow Jones low in 2009, then the index is 73% over-valued. Again, when assets are way above their baseline values, then they enter into a HIGH-RISK category. It doesn’t matter if U.S. home prices or the broader stock markets continue to move higher for a while, they are still highly risky assets.
Now, if we look at the Silver Price, we see a much different setup. Not only is the silver price way off its highs set back in 2011, but it is also just 40 cents above its 200 MA:
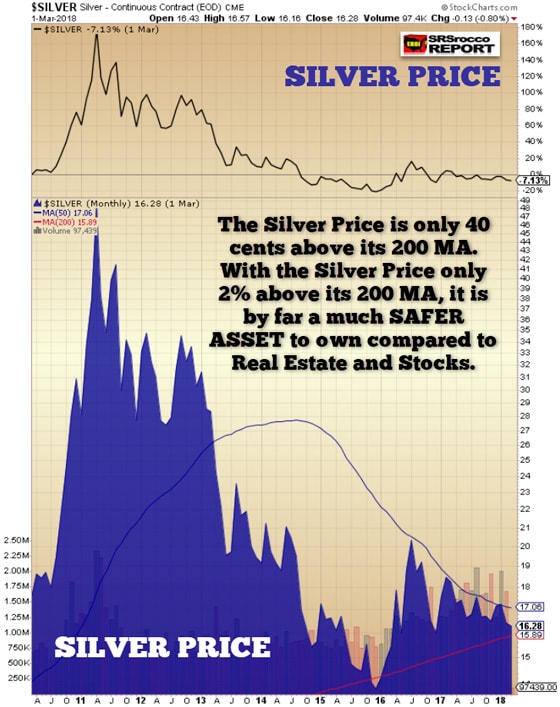
With the silver price being 2% above its 200 MA, it is the LOWEST RISK asset compared to the Dow Jones or U.S. residential real estate values. Furthermore, the Commitment Of Traders (COT) Report suggests that the very low net commercial silver short position also indicates that the silver price is bottoming:
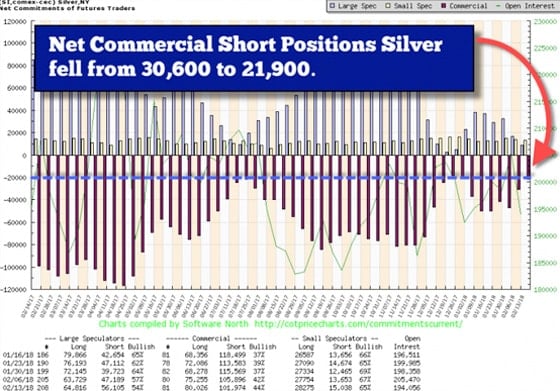
The chart above shows that the Commercials present net short position in silver is back to its cycle lows. While the Commercials could continue to liquidate more short contracts, as the silver price falls a bit lower, we are closer to forming a bottom than a top. So, if we use logic, then the silver price is a LOW-RISK asset to purchase and hold while U.S. residential real estate and stocks are HIGH-RISK assets to sell.
Of course, it will take time for these markets to correct, but nothing goes up or down forever. However, the horrible irony of how the markets will play out in the future is to watch investors get wiped out because they are unable to distinguish between HIGH and LOW-RISK assets.

About the Author:
Independent researcher Steve St. Angelo started to invest in precious metals in 2002. In 2008, he began researching areas of the gold and silver market that the majority of the precious metal analyst community has left unexplored. These areas include how energy and the falling EROI – Energy Returned On Invested – stand to impact the mining industry, precious metals, paper assets, and the overall economy.
